The observed targets are small magnetic features (mostly pores as of April 2010) on the solar disk.
Date | Observing program | Instruments | Link to data | Status | ||
---|---|---|---|---|---|---|
20 May 2008 | impromptul | IBIS, Hinode, TRACE | online data | Fully processed, comparison of IBIS and Hinode SP spectropolarimetry reported in Judge et al. (2010). Judge is working on two more papers: magnetic field diagnosis; photosphere-chromosphere-corona connections | ||
4 May 2009 | HOP 117 | IBIS, Hinode, TRACE | limited success, see the summary | |||
2-9 Sep 2009 | impromptu | IBIS, Hinode, TRACE | includes fast cadence (< 20s) IBIS data, partly reduced, see the observation log | |||
27 Jan-6 Feb 2010 | HOP 153 | IBIS, FIRS, Hinode, TRACE | Some joint FIRS/IBIS scans obtained. Slower cadence IBIS data with 18 minute FIRS rasters see the observation log | |||
3-14 Jun 2010 | HOP 153? | IBIS+FIRS |
| |||
IBIS+FIRS | 
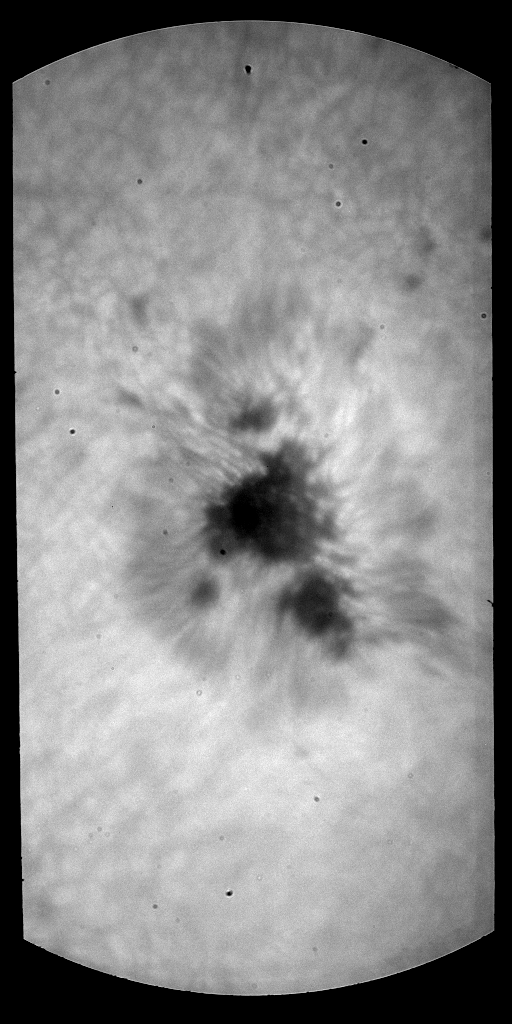
3 June 2010. Good but variable seeing.Some joint FIRS/IBIS scans obtained. 36s cadence IBIS data with 24 minute FIRS rasters of NOAA 11076 . See the observation log. One map of entire region (2 FIRS 4 slit rasters) |
White light raw images of the two pointings. | ||||
IBIS+FIRS | online data | 
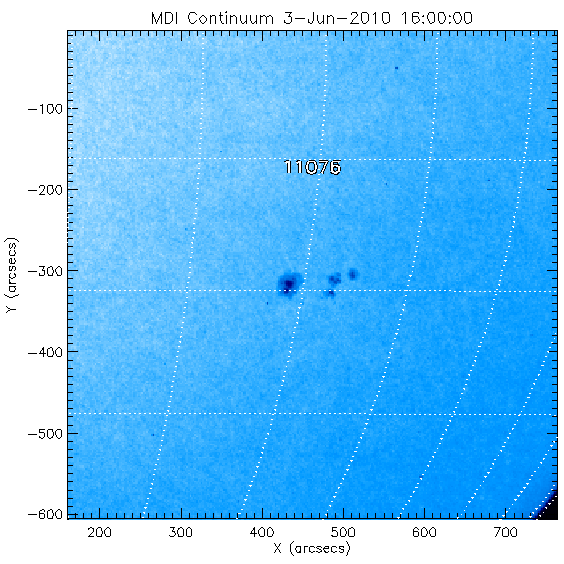
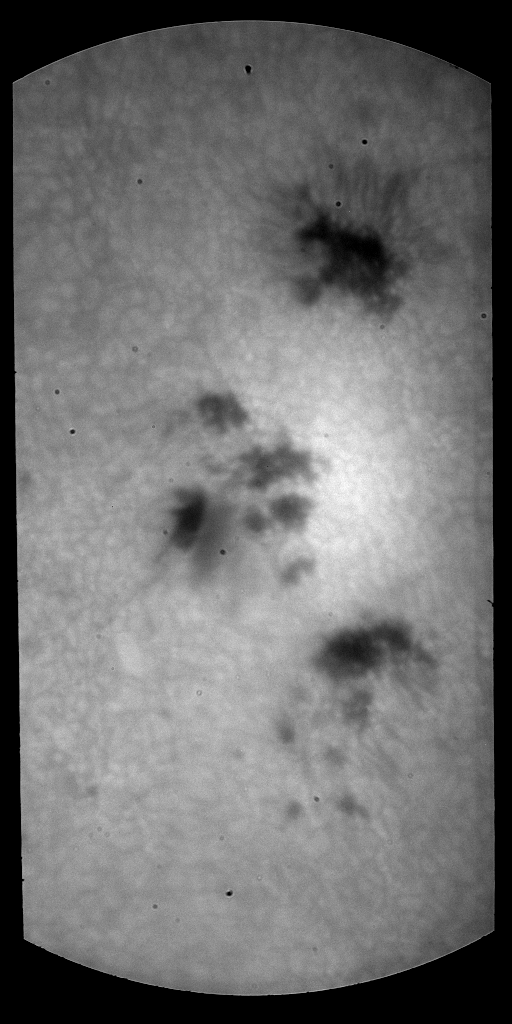
4 June 2010. Good seeing.More FIRS/IBIS scans obtained. 36s cadence IBIS data with 24 minute FIRS rasters of NOAA 11076 . See the observation log. FOUR maps of entire region (4 FIRS 4-slit rasters) for a total of about 4 hours of nice data (13:30-17:30 UT).
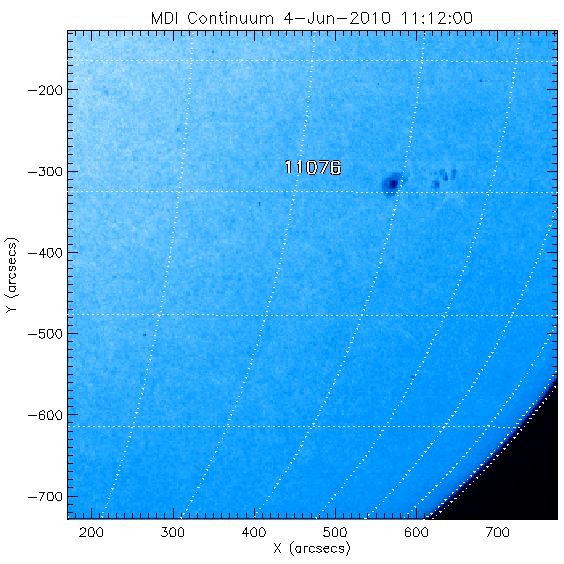
Full calibration set acquired for FIRS and IBIS (IBIS last table rotation had to be re-started). | G band image (120x120
arcsec, N is bottom right, E is top right)
![]() |
|||
IBIS+FIRS+Hinode | 
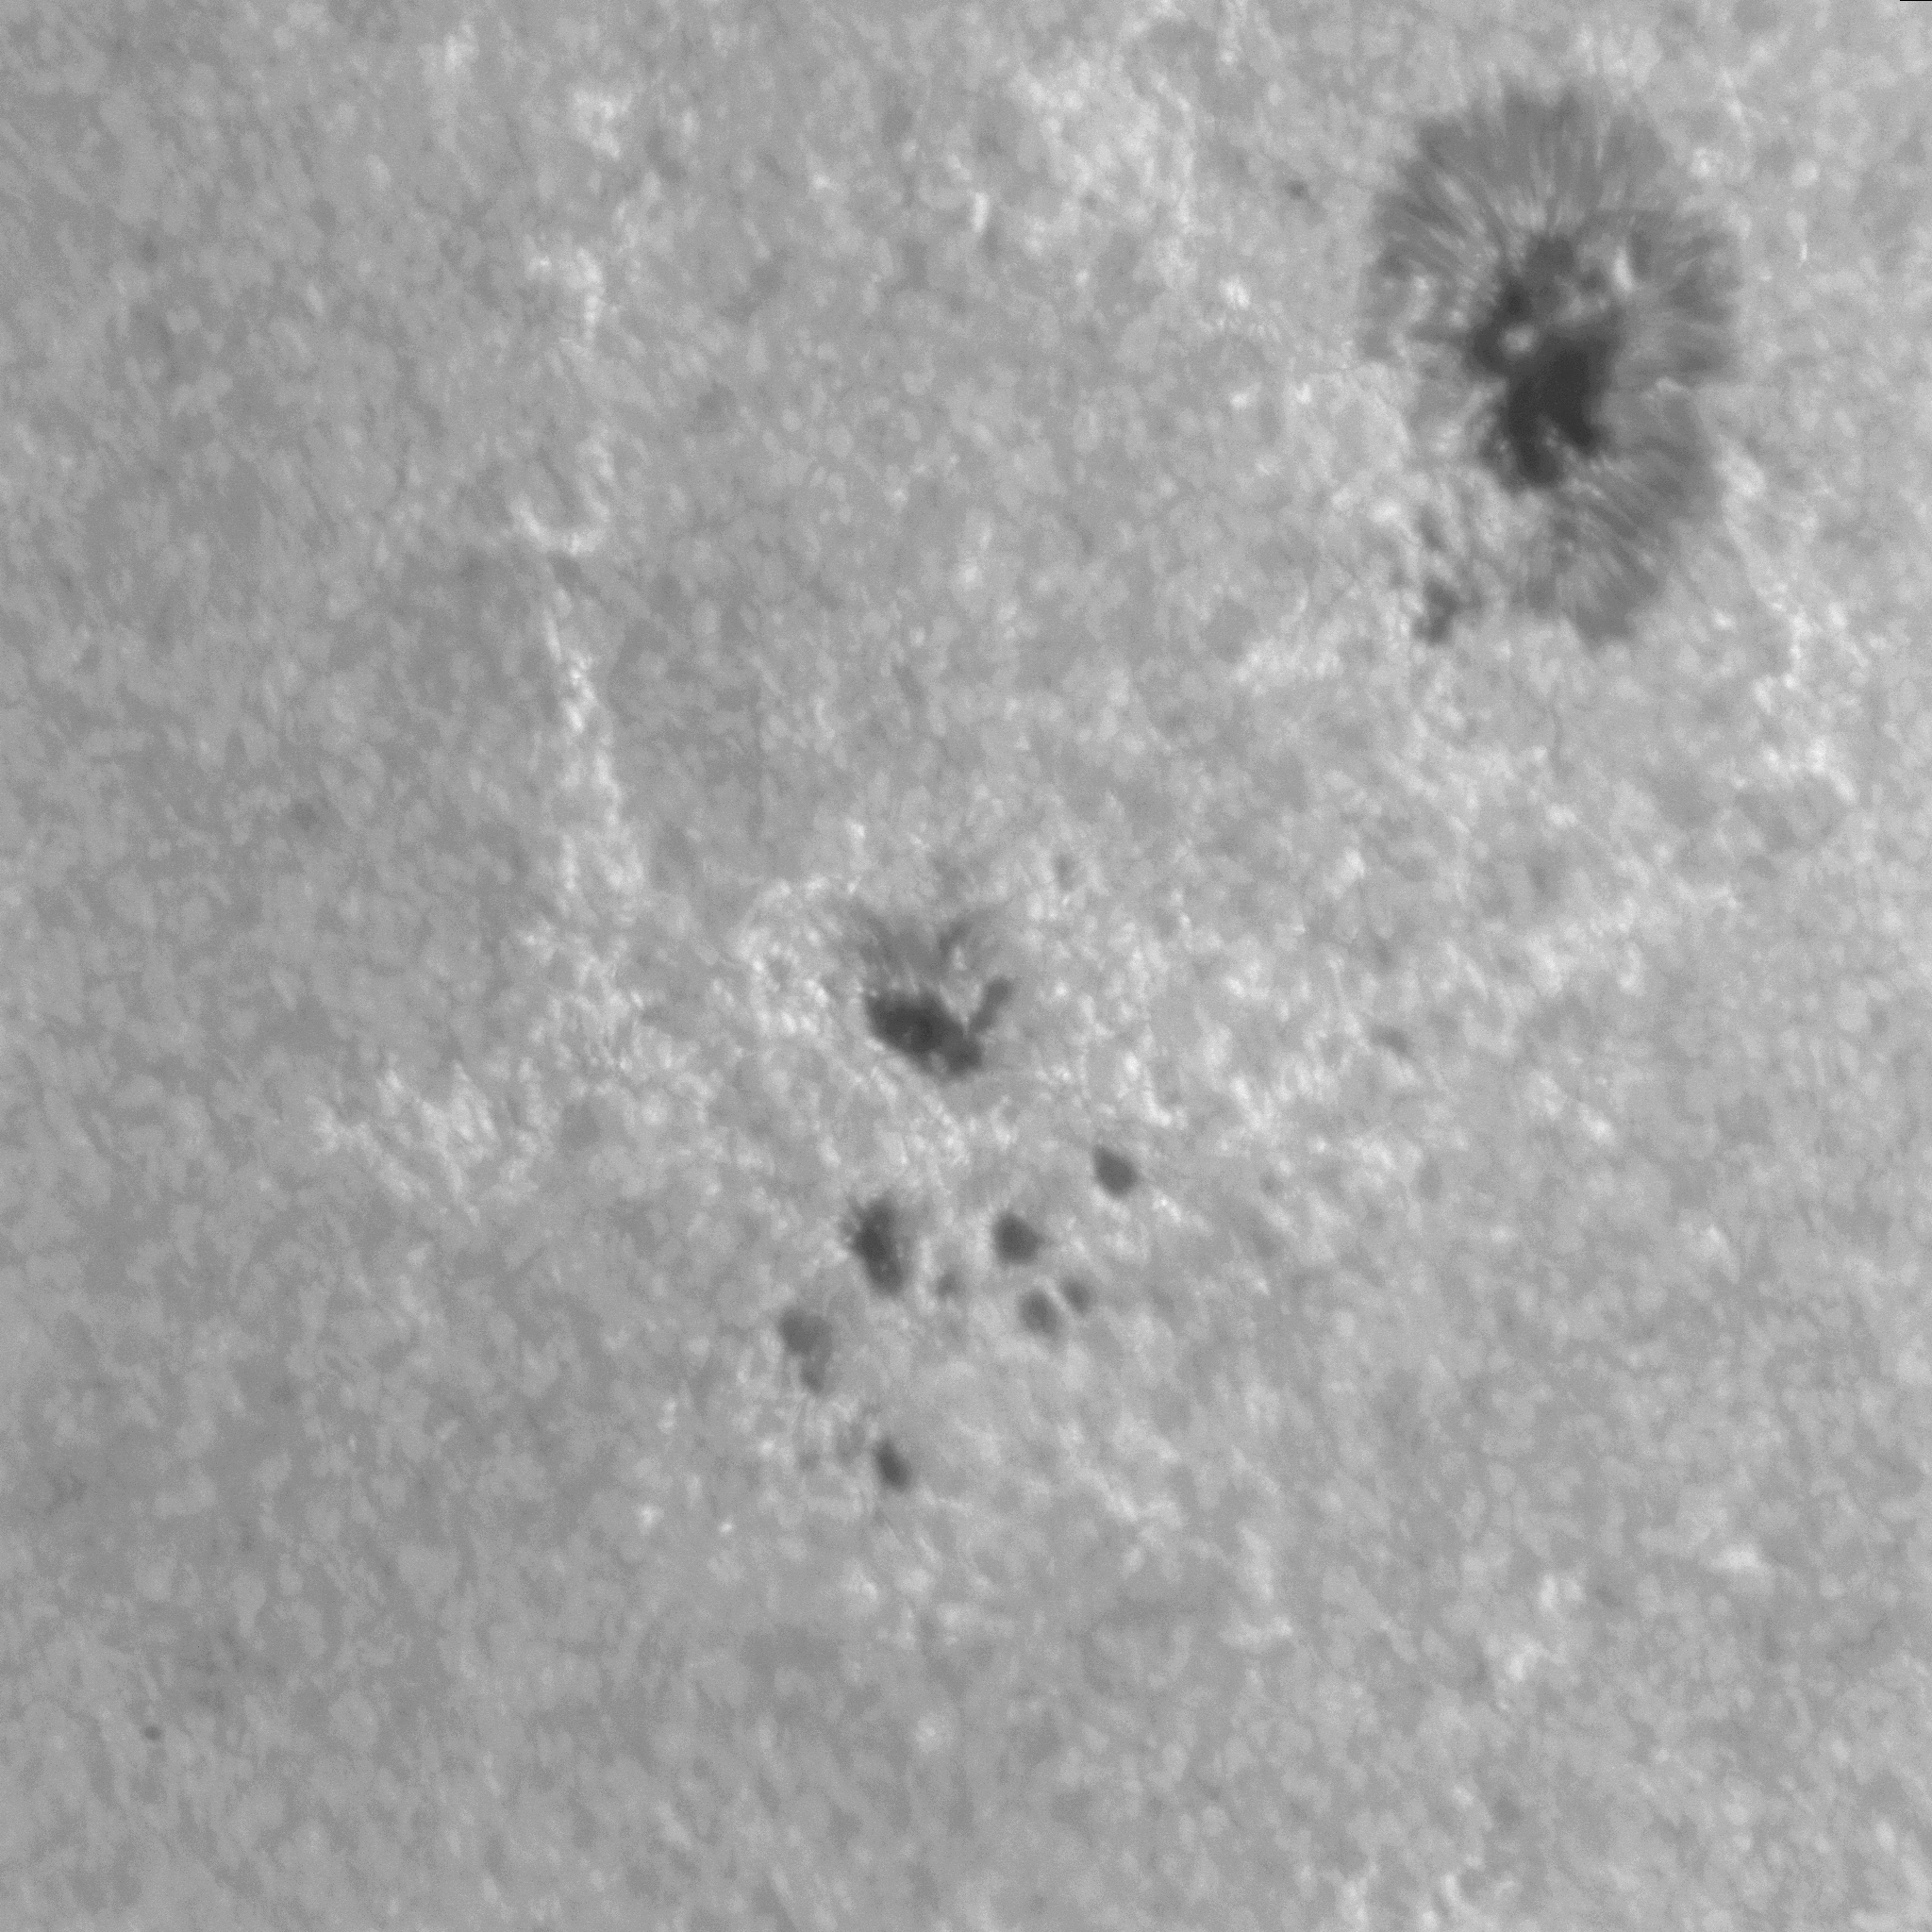
5 June 2010. Excellent variable seeing.NOAA 11076 . See the observation log. Data were acquired over 4 hours, 2 complete scans of NOAA 11076 (2x2 pointings), one of W43, N19 (2 pointings) started 16:18UT, of several pores, 1 more complete scan of NOAA 11076. |
G band image (120x120
arcsec, N is bottom right, E is top right)
![]() |
||||
IBIS+FIRS | 
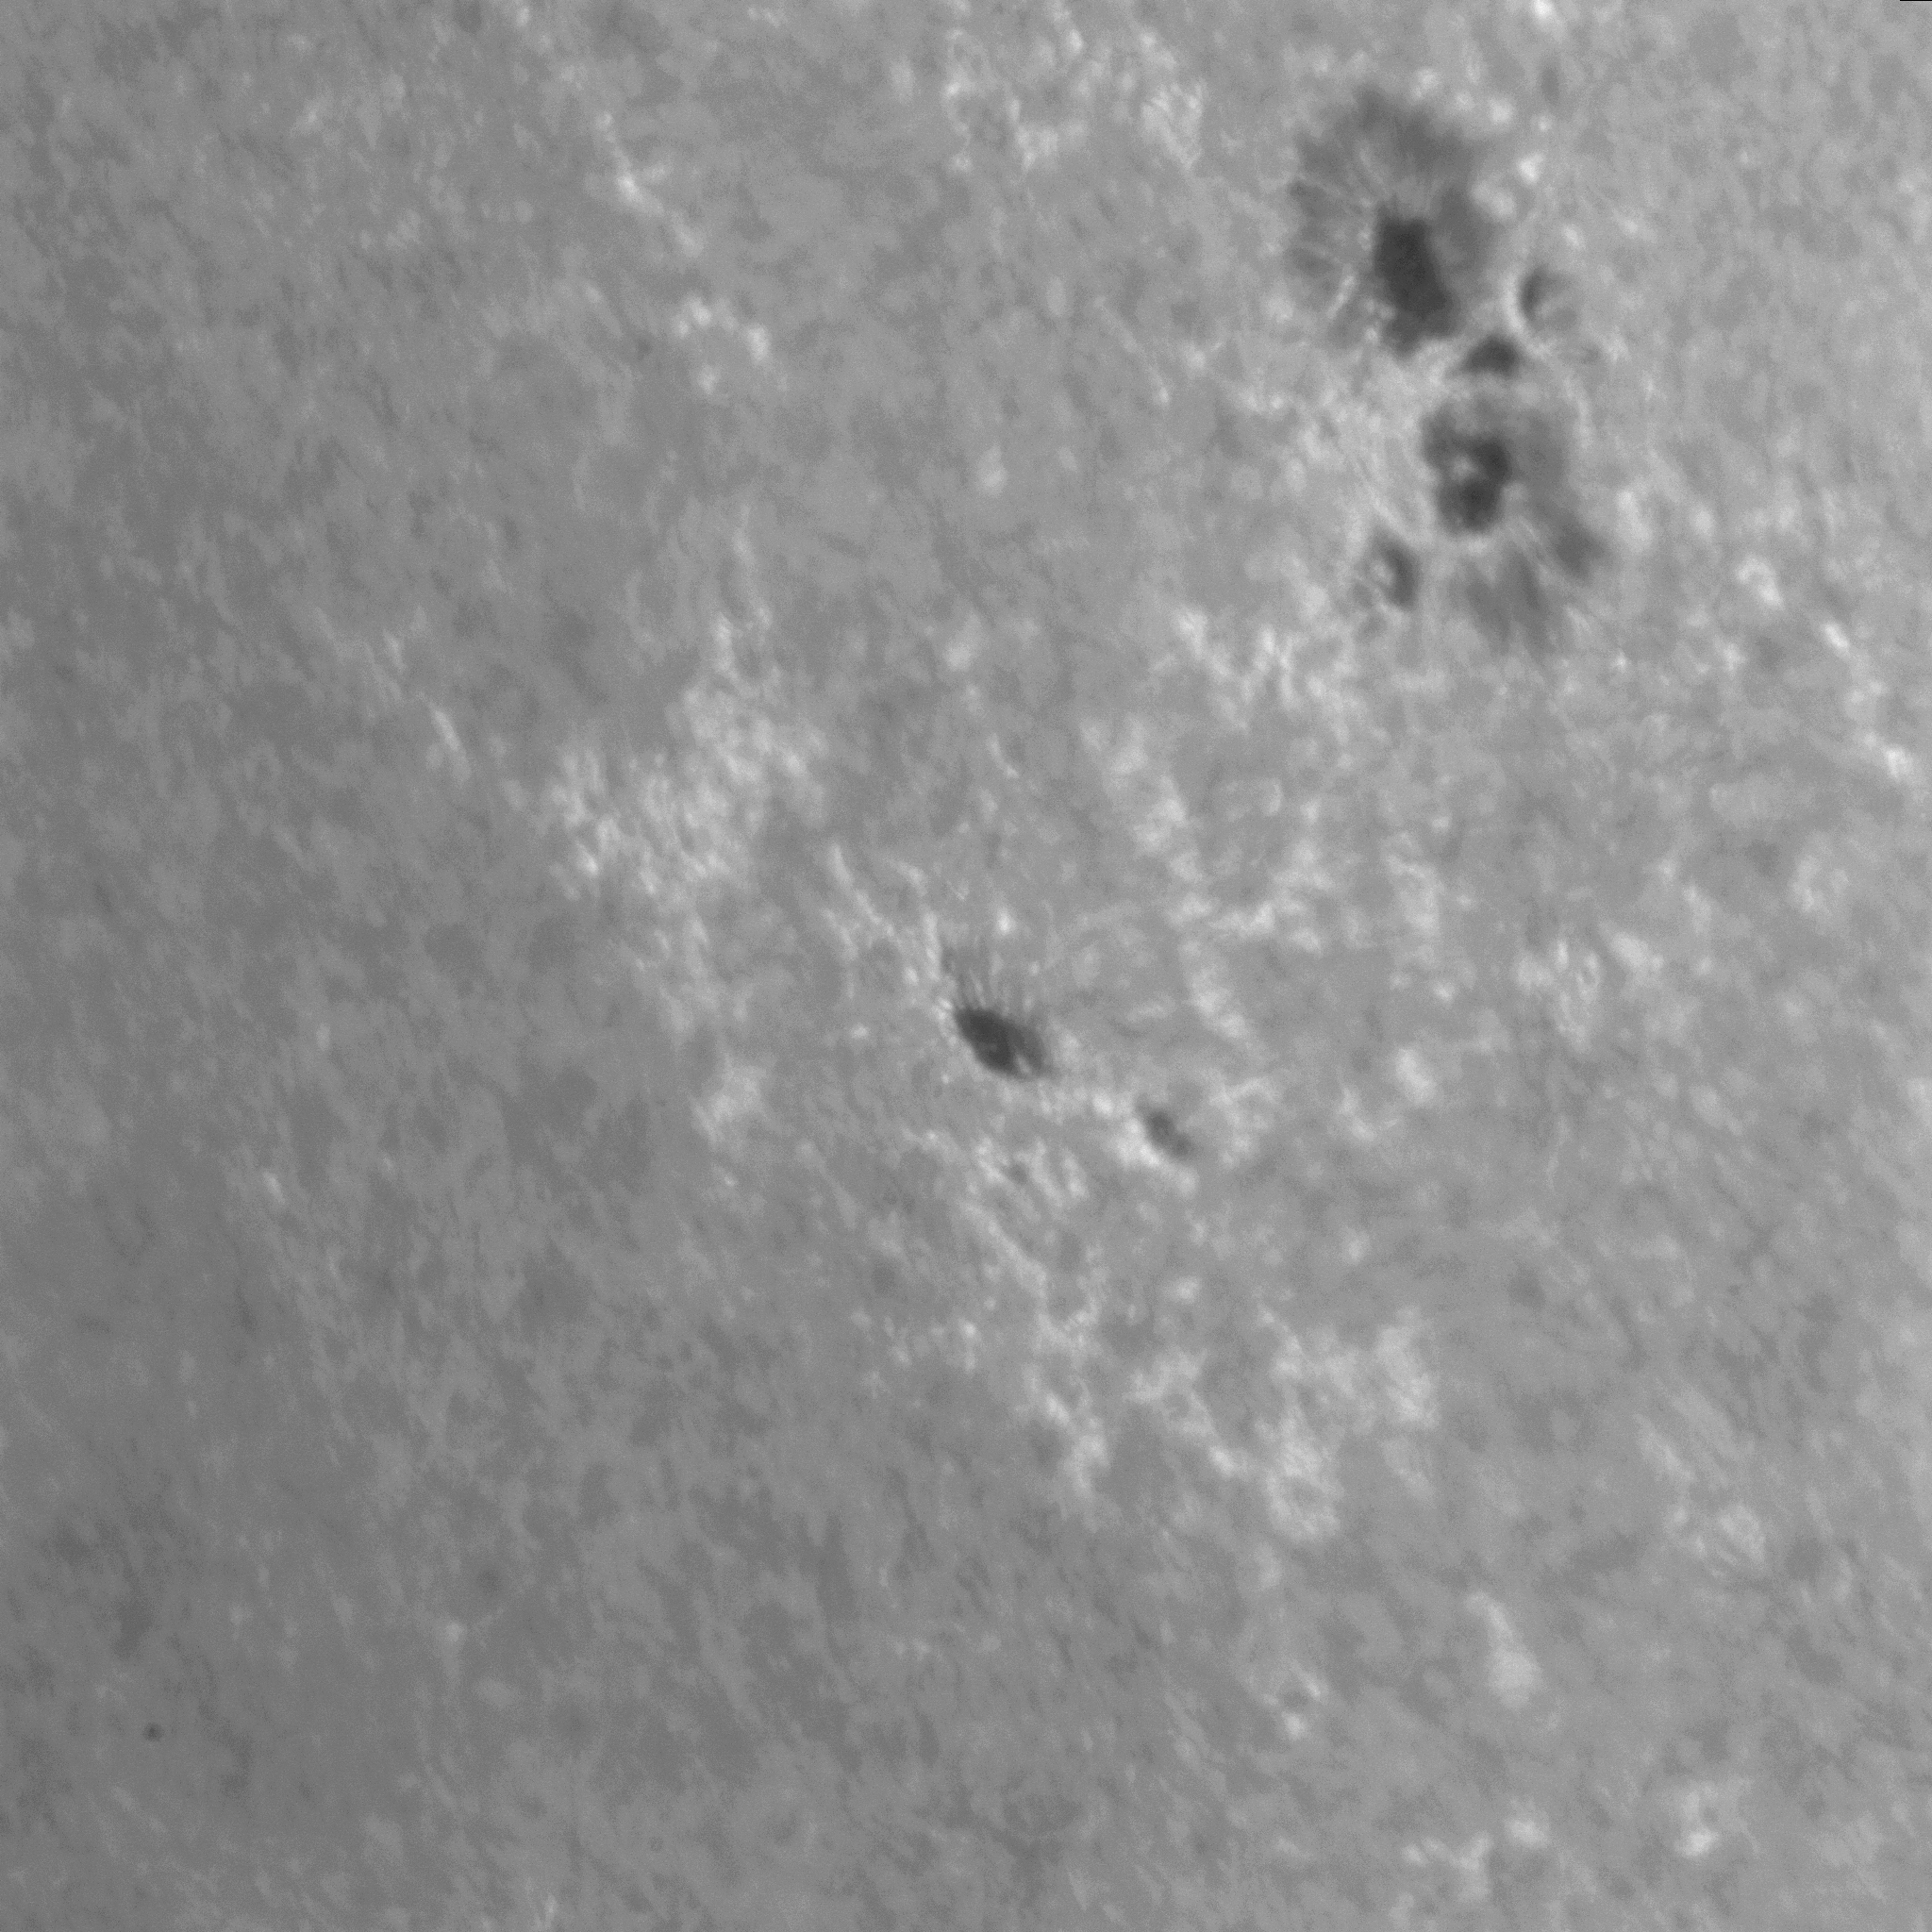
6 June 2010. Excellent variable seeing.NOAA 11076 . See the observation log. Data were acquired over 3 hours, several scans of NOAA 11076. Clouds intervened during IBIS flats (only 20 acquired). Interesting limb data acquired at end of run. |
G band image (120x120
arcsec, N is bottom right, E is top right)
![]() |
||||
IBIS+FIRS | 
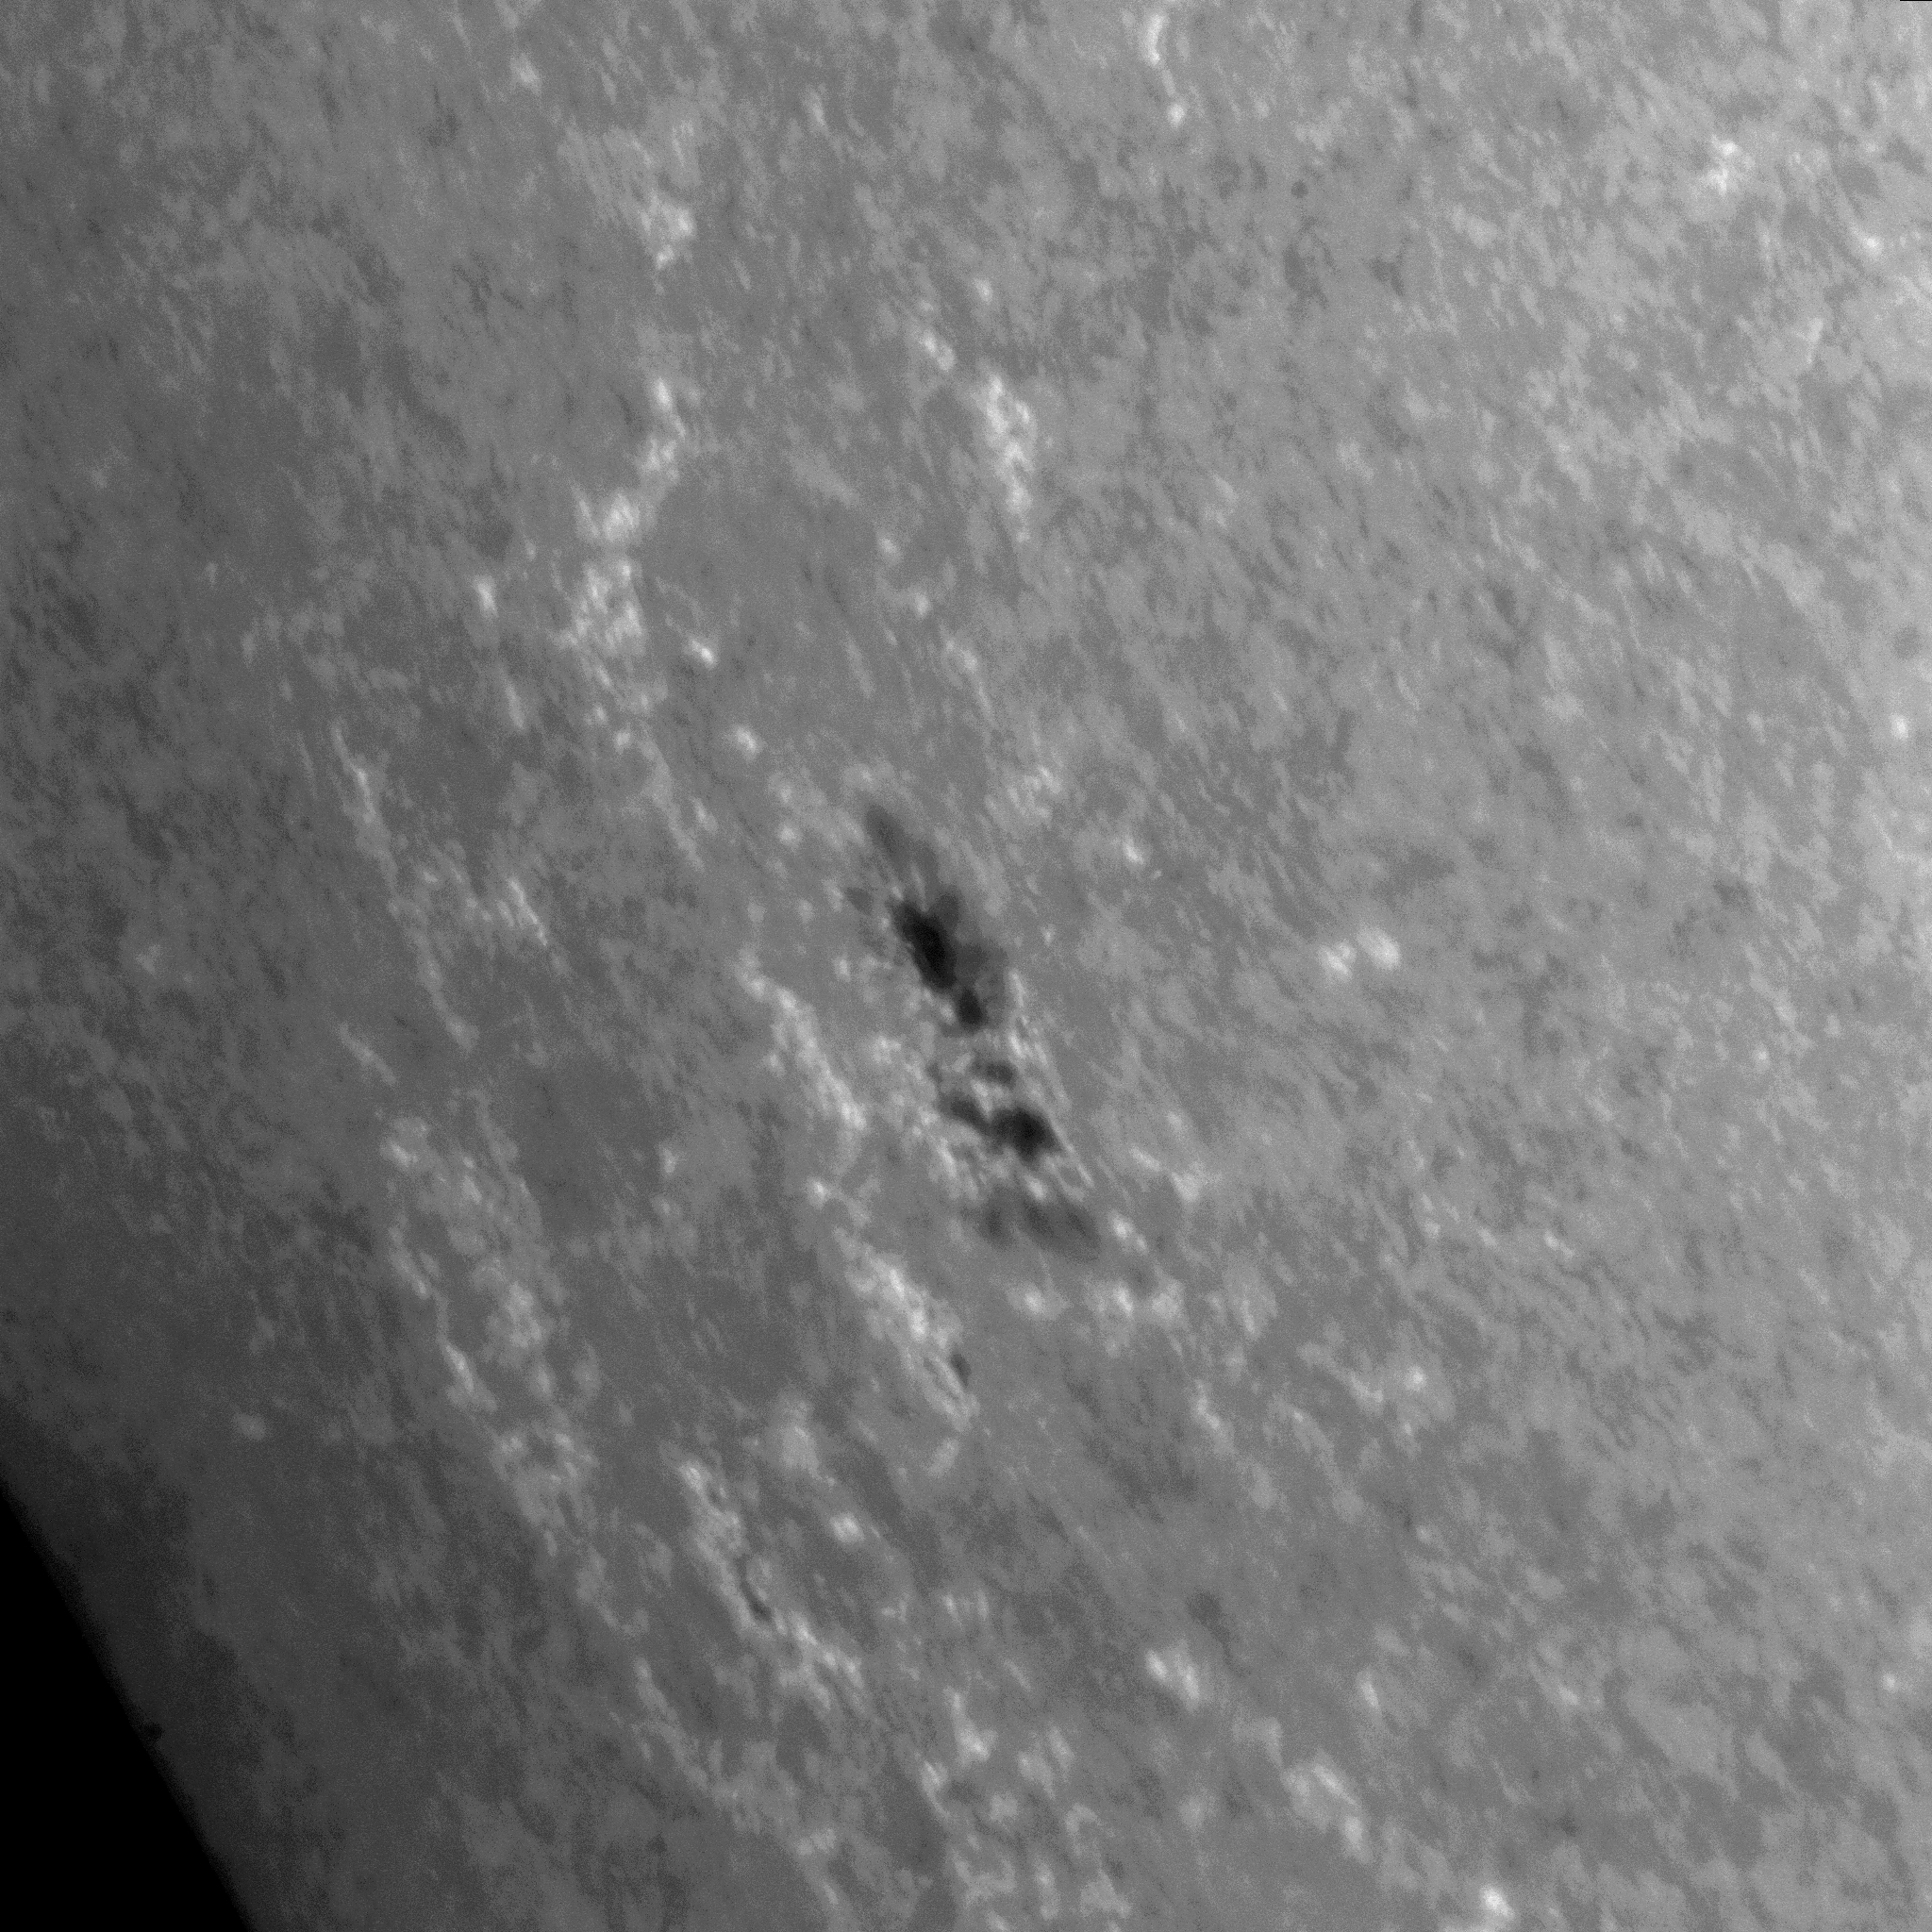
7 June 2010. Clouds.. |
|||||
IBIS+FIRS | 8 June 2010. Clouds early, excellent variable seeing.Targets: 1. limb N19 W 85 (with no AO), remnant of NOAO 11077; 2. AR near W42 S19, later named NOAA 11078. See the observation log. Interesting limb data acquired at beginning of the run. |
G band limb image N19 W 85.
![]() |
G band AR image W42 S19 ![]() |
|||
IBIS+FIRS | 
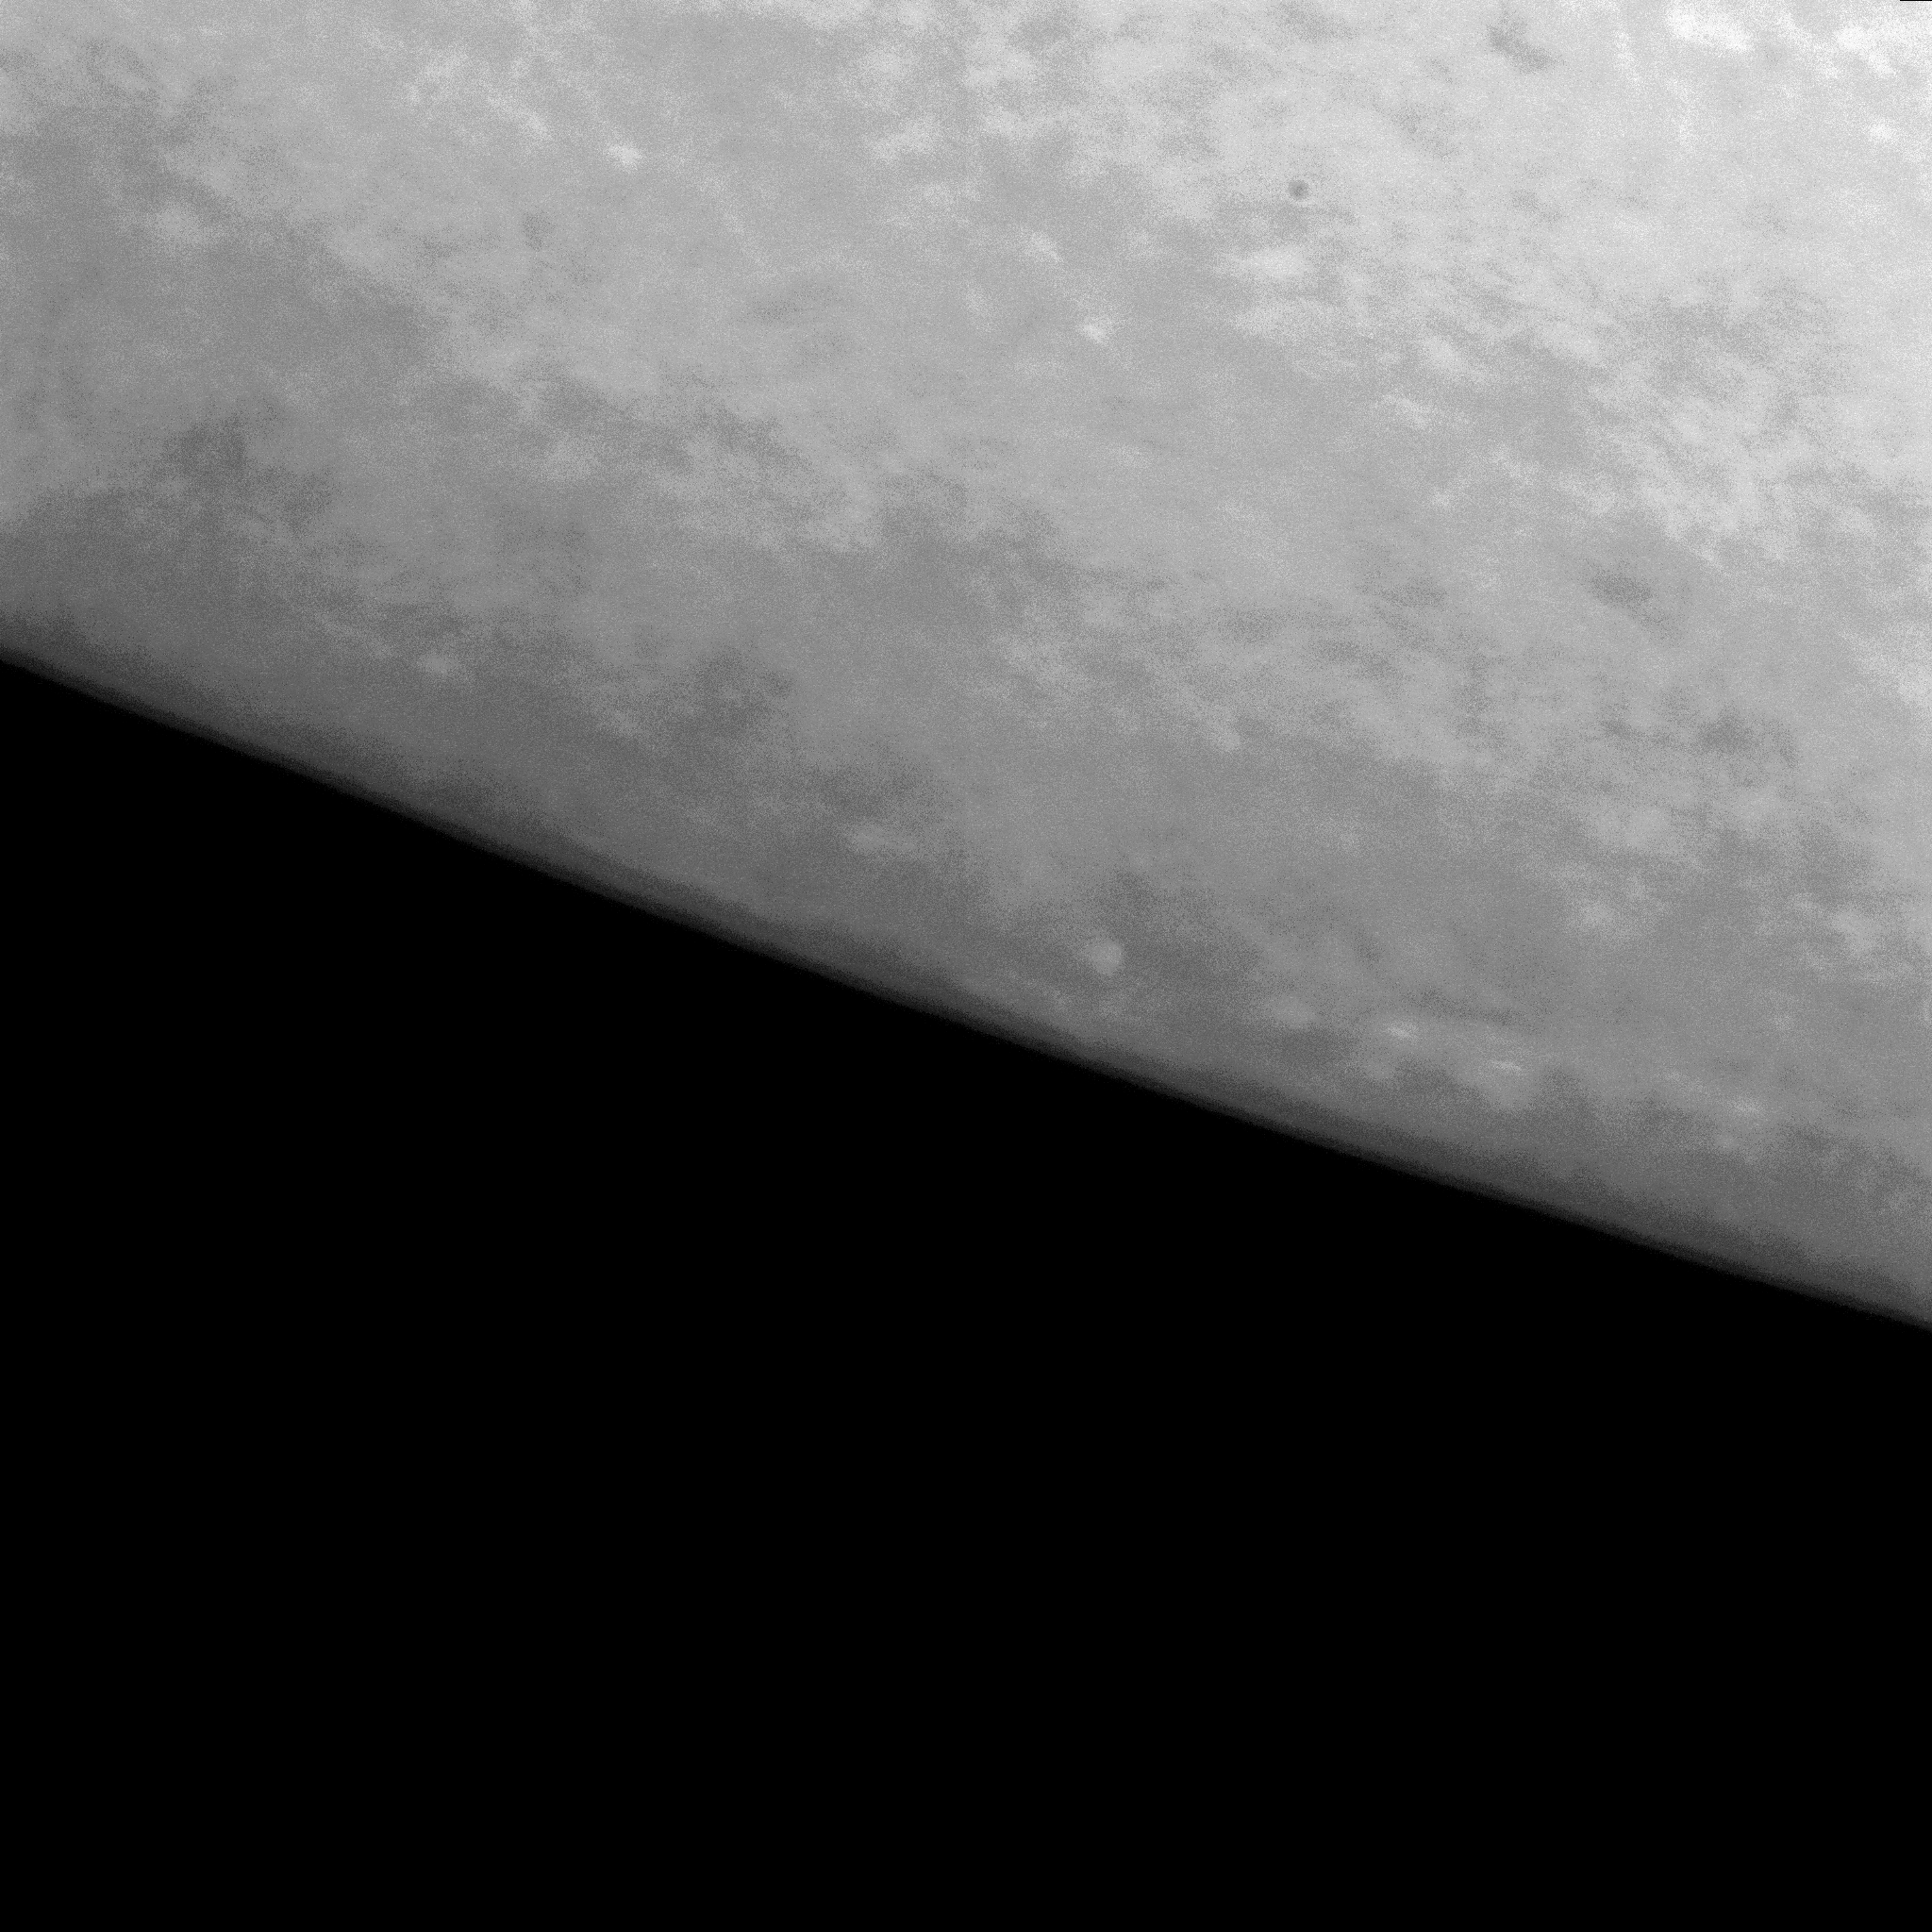
9 June 2010. Cirrus early, excellent seeing.Targets: W58 S21, NOAA 11078. See the observation log. |
G band NOAA 11078, W58 S21 ![]() |
G band NOAA 11078, W53 S21 ![]() |
|||
Small bipolar loop system at W32 S26 . See the observation log. | G band, W32 S26 ![]() |
|||||
IBIS+FIRS | 10 June 2010, some high level seeing.Targets: NOAA 11078, 11079. Observations by DST observers (Judge traveling). See the DST observers observation log (pdf). Full polarization sequences obtained, but IBIS polcals had clouds. |
|||||
IBIS+FIRS | 11 June 2010. So-so seeing.Targets: NOAA 11080. See the observation log. Full polarization sequences obtained. |
|||||
IBIS+FIRS | online data | 12 June 2010.Bad seeing early. Some cross-limb data were acquired early afternoon NOAA 11079 appear good, using off-pointing of AO. Probably the best off-limb data set of T864. | SDO AIA context ![]() |
![]() | ||
19-27 Nov 2010 T882 | IBIS+FIRS + SDO |
19 and 22 November, IBIS polcals only | ||||
23 November, IBIS+FIRS NOAA 11127 N24 W 15.3Variable seeing, full set of cals (no polcal for IBIS). Both leader spot and followers mapped. | ||||||
26 November, IBIS+FIRS NOAA 11128 S15 W E55Variable seeing, full set of cals. IBIS scans made with Fe-Ca-H and Fe-Na-H, IBIS polcal done as well. |