Thermospheric General Circulation Models
Research Highlights
Coupled Model Analysis Of an Ionospheric Storm
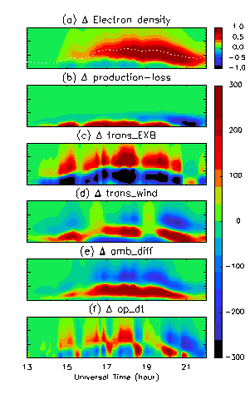 Ionospheric storms are extreme space weather phenomena involving complex interactions of several processes within the magnetosphere-ionosphere-thermosphere system. CISM scientists have used the Coupled Magnetoshere-Ionosphere-Thermosphere model (CMIT 2.0) to simulate in detail the initial phase of a December 2006 geomagnetic storm, when the geospace system was strongly driven by an interplanetary shock. After validating the fidelity of the simulation, the model was used to investigate the causes of the ionospheric responses and to quantify the relative contributions of different physical processes. The figure shows differences relative to quiet-time values for several quantities at one location (35° N, 75° W) over 10 hours, beginning approximately 1 hour before shock arrival. Differences in electron density and the rate of change in oxygen ion density are shown in the top and bottom panels. The production-loss and transport terms contributing to the ion density variation are separately shown in the middle four panels. Such "term analyses" are a powerful tool, enabled by sophisticated coupled models such as CMIT, for investigating the behavior of the complex space weather system. For example, in this case it was found that electric field changes are the dominant factor in the initial-phase storm effects in the American sector, although neutral winds and composition changes also contribute.
Lei, J., W. Wang, A. G. Burns, S. C. Solomon, A. D. Richmond, M. Wiltberger, L. P. Goncharenko, A. Coster, and B. W. Reinisch, Observations and simulations of the ionospheric and thermospheric response to the December 2006 geomagnetic storm: Initial phase, J. Geophys. Res., 113, A01314, doi:10.1029/2007JA012807, 2008.
Coupled Modeling Of The Equatorial Ionosphere During Geomagnetic Storms
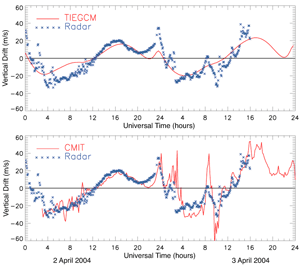 Physical interactions between the magnetosphere and the ionosphere-thermosphere affect processes in both regions during magnetic storms. CISM's Coupled Magnetosphere-Ionosphere-Thermosphere (CMIT) model provides an important step for understanding, and ultimately predicting, the coupled system behavior. The new version of CMIT introduces the NCAR TIEGCM model of the ionosphere-thermosphere, providing the capability to study global ionospheric disturbances during geomagnetic storms. The figure shows modeled equatorial vertical ion drifts (red line) compared to measurements by the Jicamarca radar (blue crosses). April 2, 2004, was a quiet day, followed by a significant geomagnetic storm that began at 2 UT on April 3. In the top panel, the stand-alone TIEGCM model captures many of the overall trends, but does not successfully represent the dynamic structure that is caused by interactions with the magnetosphere. The coupled CMIT model, in the bottom panel, provides a much better characterization of the dynamics of the coupled system. Temporal variations in the model are consistent with the data, but somewhat overestimated, due to the lack of a full characterization of region-2 shielding currents. This work, reported by Wang et al. at the Fall 2006 meeting of the American Geophysical Union, illustrates the importance and promise of using coupled models to represent the complex physics of space weather.
Wang, W., A. D. Richmond, J. Lei, A. G. Burns, M. Wiltberger, S. C. Solomon, T. L. Killeen, E. R. Talaat, D. L. Hysell, and D. Anderson, Ionospheric electric field variations during a geomagnetic storm simulated by a coupled magnetosphere ionosphere thermosphere model (CMIT), J. Geophys. Res., in press, 2007.
Connection between persistent global meteorological weather patterns and quiescent space weather conditions
 Maura Hagan in collaboration with Astrid Maute, Ray Roble, and Art Richmond (all of
ESSL/HAO) collaborated with Thomas Immel and Scott England (both of University
of California-Berkeley) in a numerical study that provides strong evidence of a
connection between persistent global meteorological weather patterns and quiescent
space weather conditions. They conducted a set of numerical experiments with the
thermosphere-ionosphere-mesosphere-electrodynamics general circulation model
(TIME-GCM) in their attempt to replicate the longitudinal variability observed in the
low-latitude ionosphere by the far ultraviolet (FUV) instrument on the IMAGE satellite.
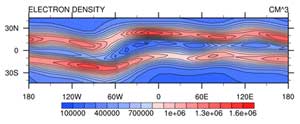
The accompanying illustration shows a 4-peaks in the TIME-GCM northern
hemisphere electron density structure associated with the equatorial ionization anomaly,
which captures the salient features of the IMAGE FUV data. Hagan and colleagues
showed that this observed variability could not be explained by the offset between the
geographic and geomagnetic equators, but could be attributed to nonmigrating tidal
effects on the E-region dynamo-driven electric field. They accounted for the these
effects by introducing tidal fields obtained from global-scale wave model (GSWM)
calculations at the 30-km TIME-GCM lower boundary. They showed that an eastward
propagating diurnal nonmigrating tide is primarily responsible for the wave 4 structure
seen in the northern hemisphere by IMAGE FUV data. This tide is excited in the
GSWM by a parameterization that accounts for latent heat release associated with
raindrop formation in the deep tropical tropospheric clouds.
Hagan, M. E., A. I. Maute, R. Roble, A. D. Richmond, T. J. Immel, and S. L. England, Connections between deep tropical clouds and the Earth's ionosphere, Geophys. Res. Lett., doi:10.1029/2007GL030142, 2007.
Figure Caption: Contours of TIME-GCM electron density (cm-3) as a function of longitude and latitude near 450 km altitude and 20 hours local solar time for March equinox and geomagnetically undisturbed conditions. This asynoptic map exemplifies the perspective of a days worth of measurements made by a slowly precessing or Sun-syncronous satellite. The red bands on either side of the magnetic equator are pre-sunset signatures of the equatorial ionization anomaly (EIA). The EIA enhancements evident at multiple longitudes are attributable to eastward electric field enhancements produced by nonmigrating zonal wind tide perturbations in the E-region dynamo region (ca. 100-150 km). These tides are excited by latent heat release associated with raindrop formation in the tropical troposphere as modeled by the GSWM and introduced into TIME-GCM at the 30-km model lower boundary.
Observations and numerical simulations of ionospheric and thermospheric disturbances associated with a geomagnetic storm on 10 September 2005
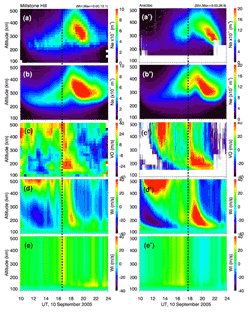 In collaboration with Larisa Goncharenko at Haystack Observatory of Massachusette Institute of Technology, and Art Richmond and Ray Roble, Gang Lu carried out a study that focused on observations and numerical simulations of ionospheric and thermospheric disturbances associated with a geomagnetic storm on 10 September 2005. During the event, the incoherent radars located in Millstone Hill and Arecibo observed a dayside positive storm phase as manifested by the enhanced electron density in the F region. The altitude-UT profile of electron density measured by both radars displayed a structure that resembles the Greek letter "Lamda". The similar structure was also reproduced by the Thermosphere-Ionosphere Electrodynamics General Circulation Model (TIE-GCM). This peculiar electron density distribution was found to be associated with vertical ion drift, which initially was upward and then became downward. Using realistic, time-dependent ionospheric convection as input, the TIE-GCM revealed that the primary cause of the positive storm response was the enhanced meridional neutral wind winds rather than the penetration magnetospheric electric field. This study reiterates the importance of neutral wind effect on ionospheric disturbances.
Fig. Caption: Altitude profiles of measured electron density (top row), sumulated electron density (2nd row), measured vertical ion drift (3rd row), simulated vertical ion drift (4th row), and the vertical ion drift component due to electric field (bottom row). The vertical dashed line mark the onset of upward lifting of the electron density peak height over Millstone Hill (left column) and over Arecibo (right column).
Long-term Climate Change In The Thermosphere
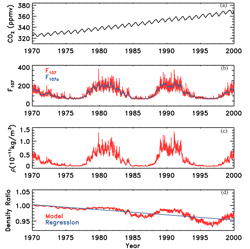
Simulations using the NCAR global mean upper atmospheric model were published in GRL by Qian et al. [2007]. A long-term decrease of thermospheric neutral density, on the order of 1.7% per decade for the past several decades, which is in agreement with results from satellite drag data analysis. This long-term decrease of neutral density is consistent with the hypothesis by Roble and Dickinson [1989] predicting cooling and contraction of the upper atmosphere due to increased greenhouse gas forcing. In the figure, Panel (a) is CO2 concentration measured at Mona Loa observatory from 1970 to 2000; Panel (b) is solar activity index F10.7 in red and its 81-day average in blue. When the model was driven by these time-varying CO2 and F10.7, it gave global mean neutral density at 400 km as shown in panel (c). It is apparent that variation in this neutral density is dominated by solar-cycle variation. This solar-cycle variation needs to be removed in order to extract the relatively very small long-term change. Therefore, another model run was conducted in which the CO2 concentration was fixed at 1970 level but using same solar forcing as shown in panel (b). The ratio of neutral density from the two model run was then calculated and shown in panel (d) in red. The blue is its linear regression, which gives an average decrease rate of neutral density of 1.7%/decade. Panel (d) also shows that the density decrease is greater at solar minimum than solar maximum, which is also in agreement with results from satellite drag data analysis.
Qian, L., R. G. Roble, S. C. Solomon, and T. J. Kane, Calculated and observed climate change in the thermosphere, and a prediction for solar cycle 24, Geophys. Res. Lett., 33, 23705, doi:10.1029/2006GL027185, 2007.
Altitude variations of the horizontal thermospheric winds during geomagnetic storms
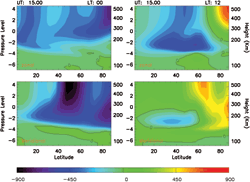 It is generally assumed that viscosity smoothes out vertical gradients of the horizontal thermospheric winds in the upper thermosphere, and thus observations of neutral winds at one height can be used at other altitudes in this region. In this paper we present neutral wind simulations of the May 1997 geomagnetic storm using the Coupled Magnetosphere-Ionosphere-Thermosphere (CMIT) model. The model results show that during quiet periods the assumption of a shearless vertical profile of the horizontal winds is generally valid in low and middle latitudes; although vertical shears do occur in wind profiles in the upper thermosphere in some locations at higher latitudes. During disturbed periods large variations in the vertical profiles of the upper thermospheric winds are seen globally in the model simulations. A diagnostic analysis of the forcing processes in the neutral momentum equations shows that: 1) During quiet time there are shearing forces, most noticeably the pressure gradient and ion drag, in the upper thermosphere that result in a net momentum forcing that changes with height; this induces altitude variations in the winds profiles at high latitudes and sometime even at middle latitudes; 2) During storm time, momentum advection, which is relatively weak during the quiet time, becomes a dominant force globally. Pressure gradient forces are also significantly enhanced. Ion drag, on the other hand, can be enhanced or suppressed depending on the location of positive or negative effects. All these forces exhibit significant altitude variations that lead to a net force that is greatly enhanced and has large vertical shears. This produces globally enhanced neutral winds that vary with height; 3) Viscosity is less important than other forcing processes during both the quiet and storm periods, and thus can not prevent shears from occurring in the vertical profiles of the horizontal winds. Viscosity has an insignificant effect on vertical shears that change with height linearly. It, however, does restrict vertical shears that vary nonlinearly with height. The effectiveness of the viscosity in restricting such shears depends on its magnitude. In our simulations, viscosity is weaker than other forcing processes and thus is a relatively slow process, so it will take a few hours for viscosity to reduce such shears.
Wang, W., A. G. Burns, M. Wiltberger, S. C. Solomon, and T. L. Killeen, Altitude variations of the horizontal thermospheric winds during geomagnetic storms, J. Geophys. Res., 113, A02301, doi:10.1029/2007JA012374, 2008.
Fig. Caption: Neutral winds (m/s, northern hemisphere) during storm time at 1500 UT on May 15, 1997. The left hand side panels are winds at local midnight (0000 LT), and the right hand side panels are winds at local noon (1200 LT). Top panels are zonal winds and lower panels are meridional winds. In these plots, the left hand side vertical axis is pressure levels while right hand side shows averaged heights over latitudes for the corresponded local times.

