AMIE
AMIE Applied to March 20–21, 1990:
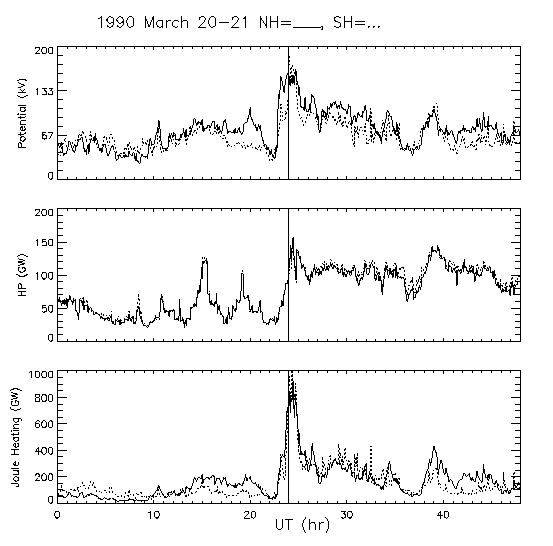
The AMIE procedure is used to infer the electric potential, conductivity and currents in the northern hemisphere during the geomagnetic storm which occurred March 20 through 21, 1990.
Imagery - still images and animations - generated from the output of the AMIE procedure shows interesting ionospheric features. The animation sequences show Hall Conductivity with Height Integrated Current, Electric Potential, and Joule Heating prior to, during and after sudden storm commencement
Contents:
The Pre-storm period, March 20, 1990.
The onset of the storm event.
The Post-storm period, March 21, 1990.
Pre-Storm Sudden Commencement (Pre SSC):
Equivalent Current and Hall Conductance
Storm Sudden Commencement (SSC):
Post-Storm Sudden Commencement (Post SSC):
Equivalent Current and Hall Conductance
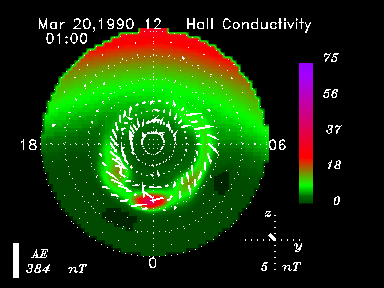
20 March 1990 Pre-storm Sudden Commencement Equivalent Current and Hall Conductance:
Figure of AMIE-derived parameters(potential, joule heating)
MPEG Movies:
- 00:00–06:10 UT: Frequent Bz polarity changes with IMF tangential components of magnitude less than 8 nT, average equivalent current values of 400 kAmp, and small expansions and contractions of the auroral oval seen in the Hall conductance.(1 Mb)
- 06:15–10:00 UT: Average equivalent current values of 300 kAmp with quiet, contracted auroral oval seen in Hall conductance patterns. (531 Kb)
- 10:00–11:00 UT: Equivalent current peaks of ~600 kAmp with apparent southward IMF turning followed by decay as IMF turns northward, auroral oval expansion and parital contraction.(200 Kb)
- 11:05–13:00 UT: Average equivalent current values of ~400 kAmp inferred polar cap expansion and auroral oval expansion after 1200 UT.(367 Kb)
- 13:00–21:15 UT: Average equivalent current values of 700 kAmp and active auroral oval.(1.5 Mb)
- 21:20–22:45 UT: Average equivalent current values of 300 kAmp and quiet, contracted auroral oval.(283 Kb)
20 March 1990 Pre-Storm Sudden Commencement Electric Potential:
Figure of AMIE-derived parameters(potential, Joule heating)
MPEG Movies:
00:00–06:10 UT, Rapid IMF Bz Oscillations
- 00:00–00:20 UT: Normal 2 cell convection pattern, dayside and nightside reconnection in balance.(96 Kb)
- 00:25–00:50 UT: Convection retreats to nightside.(99 Kb)
- 00:55–01:35 UT: Dayside reconnection begins, inferred polar cap expansion.(138 Kb)
- 01:35–1:55 UT: Small geosynchronous particle injection, dayside convection decays followed by enhancement.(93 Kb)
- 02:00–02:40 UT: Inferred polar cap expansion.(142 Kb)
- 02:40–4:20 UT: Distorted 2 cell convection influenced by large negative By component of IMF.(307 Kb)
- 04:20–5:15 UT: Weak convection pattern.(173 Kb)
- 05:20–06:10 UT: Normal 2 cell convection pattern, convection retreats to nightside.(154 Kb)
06:15–10:30 UT, IMF Data Gap
- 06:15–08:30 UT: Weak convection signatures interspersed with normal 2 cell convection followed by dominate nightside convection. (326 Kb)
- 08:35–9:20 UT: Dayside reconnection begins, dayside convection enhances, inferred polar cap expansion.(128 Kb)
- 08:40–10:10 UT: Dayside convection enhances, polar cap expansion begins, nightside reconnection begins, small geosynchronous particle injection event followed by normal two cell convection.(264 Kb)
- 10:15–11:10 UT: Strong 2 cell convection, rapid nightside variations allowed by decay of dayside convection and dominate nightside convection.(200 Kb)
11:00–21:15 UT, Bz negative, By variable
- 11:15–12:50 UT: Dayside convection begins, expanded two cell convection and geosynchronous particle injection event at ~12:30 UT followed by development of distorted dayside convection.(305 Kb)
- 12:55–17:00 UT: Normal two cell convection, average cross polar cap voltage ~80 kV.(793 Kb)
- 17:00–18:05 UT: Rapid nightside variations and geosynchonous particle injection event.(233 Kb)
- 18:10–19:00 UT: Normal two cell convection, average cross polar cap voltage ~75 kV.(200 Kb)
- 19:05–19:55 UT: Rapid nightside variations and geosynchonous particle injection event.(207 Kb)
21:20–22:40 UT, Bz positive, Storm Sudden Commencement at 22:45 UT
- 20:00–21:15 UT: Strong two cell convection, peak cross polar cap voltage~100 kV, followed with decay of dayside convection.(237 Kb)
- 21:20–22:30 UT: Convection retreats to nightside.(229 Kb)
- 22:35–23:45 UT: Storm Sudden Commencement.(326 Kb)
20 March 1990 Pre-Storm Sudden Commencement Joule Heating Variations:
Figure of AMIE-derived parameters(potential, Joule heating)
MPEG Movies:
- 00:00–04:15 UT: Bz predominantly negative with brief positive excursions, globally integrated Joule heating average value ~125 GW.(318 Kb)
- 04:20–09:30 UT: Bz predominantly positive, few brief negative excursions, globally integrated Joule heating average value ~75 GW.(355 Kb)
- 09:30–11:00 UT: Probable Bz negative, globally integrated Joule heating average value ~75 GW.(134 Kb)
- 11:00–13:00 UT: Bz negative, globally integrated Joule heating average value ~100 GW.(169 Kb)
- 13:00–21:00 UT: Bz negative, globally integrated Joule heating average value ~100 GW.(644 Kb)
- 21:00–22:45 UT: Bz positive, globally integrated Joule heating average value ~50 GW.(139 Kb)
- 22:50–0:200 UT: Bz negative, SSC, high speed flow, globally integrated Joule heating average value ~500 GW, with peak value of ~600 GW.(334 Kb)
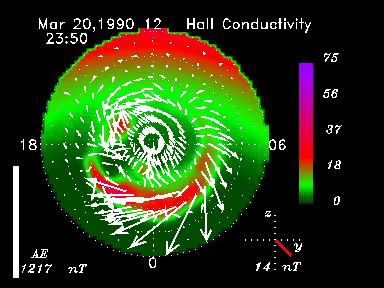
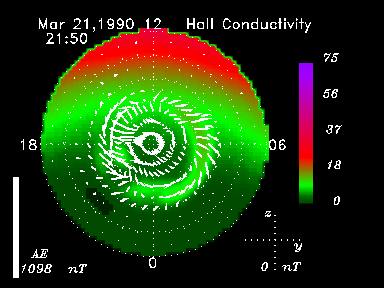
21 March 1990 Post-Storm Sudden Commencement Equivalent Current and Hall Conductance:
Figure of AMIE-derived parameters(potential, Joule heating)
MPEG Movies:
- 22:45–23:05 UT: Rapid southward turning of IMF, current system response to SSC begins.(127 Kb)
- 23:10–01:00 UT: Equivalent current peaks of ~1500 kAmp after SSC with significant auroral oval expansion. IMF Bz component is negative with high speed solar wind flow.(562 Kb)
- 01:05–10:40 UT: Average equivalent current values of 700 kAmp, active auroral oval; repetitive enhancements and decays of dayside and nightside current systems.(2.2 Mb)
- 10:45–13:10 UT: Average equivalent current now at 400 kAmp, dayside current system active, and auroral oval contracts.(485 Kb)
- 13:15–15:55 UT: Peak equivalent current of ~1400 kAmp with average of 800 kAmp and auroral oval expansion.(607 Kb)
- 15:55–23:55 UT: Auroral oval continues expansion with average equivalent current values of 700 kAmp.(1.7 Mb)
21 March 1990 Post-Storm Sudden Commencement Electric Potential:
Figure of AMIE-derived parameters(potential, Joule heating)
MPEG Movies:
- 02:15–10:35 UT: Vigorous 2-cell convection with an average cross polar cap voltage of ~100 kV. Continous nightside disturbances. Multiple geosynchronous particle injection events.(2.1 Mb)
- 10:45–10:50 UT: Highly structured convection followed by development of distorted 2-cell convection.(80 Kb)
- 11:00–13:15 UT: IMF data gap ends. Extreme distortion of dayside convection develops, Nightside convection dominates. Cross polar cap voltages decay to ~50 kV.(426 Kb)
- 13:25–14:15 UT: Distorted convection gives way to development of more normal 2-cell convection. Inferred polar cap expansion begins.(214 Kb)
- 14:25–15:50 UT:Moderately disturbed two cell pattern.(393 Kb)
- 15:55–17:10 UT: Nightside disturbances begin. Large particle injection event is followed by continuing nightside disturbances. By polarity changes twice followed by normal 2-cell convection. (308 kB)
- 17:15 -18:05 UT: Nightside disturbances begin. Geosynchronous particle injection event. (221 Kb)
- 18:15–23:55 UT: Repetitive periods of normal 2-cell convection events. (1.3 Mb)
21 March 1990 Post-Storm Sudden Commencement Joule Heating Variations:
Figure of AMIE-derived parameters(potential, Joule heating)
MPEG Movies:
- 02:00–10:45 UT: Bz predominantly negative, high speed flow, repetitive enhancements and reductions, globally integrated Joule heating average value ~200 GW.(783 Kb)
- 10:45–13:30 UT: Bz predominantly positive, globally integrated Joule heating average value ~50 GW.(225 Kb)
- 13:30–16:00 UT: Bz predominantly negative, By polarity changing, globally integrated Joule heating average value ~400 GW.(245 Kb)
- 16:00–23:55 UT: Bz negative, globally integrated Joule heating average value ~200 GW.(701 Kb)
Data Provided by:
-
W F Denig and F J Rich, Phillips Laboratory
O de la Beaujardiere, SRI International
J M Ruohoniemi, APL
E Friis-Christensen, Danish Meteorological Institute
J C Foster, Haystack Observatory
T Hughes, NRC Canada
R P Lepping, Laboratory for Extraterrestrial Physics, NASA
C G Maclennan, AT&T Bell Laboratories, Murray Hill, NJ, USA
A McEwin, Bureau of Mineral Resources, Canberra, Australia
L Morris, National Geophysical Data Center, Boulder, CO, USA
R J Pellinen, Finnish Meteorological Institute,Helsinki, Finland
R J Morris and G. B. Burns, Australian Antarctic Division,Kingston, Tasmania, Australia
V Papitashvili, University of Michigan, Ann Arbor, MI, USA
J L Scali, University of Massachusetts, Lowell, MA, USA
Schlick and J. Bitterly, Universitee Louis Pastuer,Strasbourg, France
J R Taylor, T K Yoeman and M Lester, University of Leicester,Leicester, U. K.
O Troshichev, Arctic and Antarctic Res Inst, St. Petersburg,Russia
P Van Eyken, EISCAT Scientific Association,Ramfjordbotn, Norway
N Sato, Nat Inst of Polar Research, Tokyo, Japan
P Sutcliffe, Hermanus Magnetic Observatory,Hermanus, South Africa
L Tomlinson, Institute of Geological and Nuclear Science Ltd,Christchurch, New Zeland