PIKAIA - An Introduction to Genetic Algorithms for Numerical Optimization
General Information
This Page gives access to additional material supplementing the paper An Introduction to Genetic Algorithms for Numerical Optimization, by Paul Charbonneau (HAO/NCAR). The paper was originally to appear in the Proceedings of the 1998 Mini-Workshop on Numerical Methods in Astrophysics, organized by Viggo Hansteen and Mats Carlsson and held June 03-05 at the Institute of Theoretical Astrophysics, University of Oslo, Norway. For reasons beyond the organizer's control the Proceedings were never published. so that as of April 2002 the Tutorial is now "officially" published as the NCAR Technical Note 450+IA.Although the tutorial paper is self-contained, many exercises require that you obtain a copy of the genetic algorithm-based optimization subroutine PIKAIA. The idea is that by the time you have read through the tutorial and have worked through the exercises, you should be in good shape to use PIKAIA to solve whatever global optimization problem you might encounter in your own research. To obtain a postscript copy of the tutorial, Click Here. (Size: 4Mb)
To get to the PIKAIA Homepage, Click Here.
To retrieve the PIKAIA software, Click Here.
For queries, contact Paul Charbonneau, HAO/NCAR, paulchar@ncar.ucar.edu.
Animations
The following are various animations complementing the tutorial. Little background material is provided here, so you should have the tutorial on hand if you really want to understand what is going on. All animations are in MPEG format, and should be viewable with either Mosaic or Netscape browsers.
Section 1.2: Downhill Simplex on P1
The panel on the left shows an top view of the 2D landscape defining P1 (see also Fig. 2 in tutorial). The blue-to-white scale codes elevation. Two initial simplex are shown; the green one will converge to a secondaey extremum, while the purple one will converge globally. The (x,y) location and correponding function value of the best node of the purple simplex are listed in the bottom right corner. The panel on the upper right shows convergence curves (1-f(x,y) versus generation) for the two simplex. The vertical axis is logarithmic. From the fourth move onward the animation does a closeup on the central peak, otherwise the purple simplex is too small to remain visible.
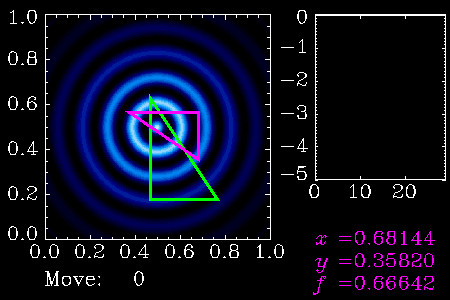
Click on above image to start animation (size: 0.33Mb)
Section 3.4: GA2 on P1
The panel on the left shows an top view of the 2D landscape defining P1 (see also Fig. 2 in tutorial). The blue-to-white scale codes elevation. Green dots are individuals in the population, and the large yellow dot is the current best of the generation. Its (x,y) location and correponding function value are listed in the bottom right corner. The panel on the upper right shows convergence curves (1-f(x,y) versus generation) for the best individual (yellow) and median-ranked (green). The vertical axis is logarithmic. The green line tracks the variation of the mutation rate in the course of the run (also listed in green below the panel).
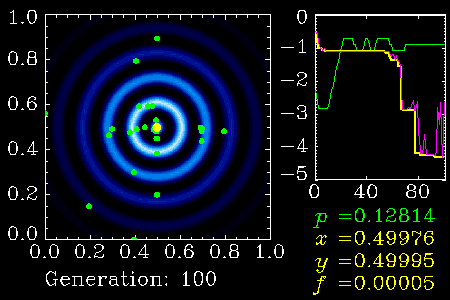
Click on above image to start animation (size: 1.1Mb)
Solutions to most Exercises
The following links give you access to small(ish) postscript documents that give solutions to all exercises. One document covers all Exercises in one section.
Data for Exercise 4.1
The following link lets you access the radial velocity data for the star rho Corona Borealis, needed for exercise 4.1. The first column is the Julian date, the second the radial velocity in m/s, the third the estimated error on the radial velocities, also in m/s.To retrieve the data Click Here. (Save as Plain Text)