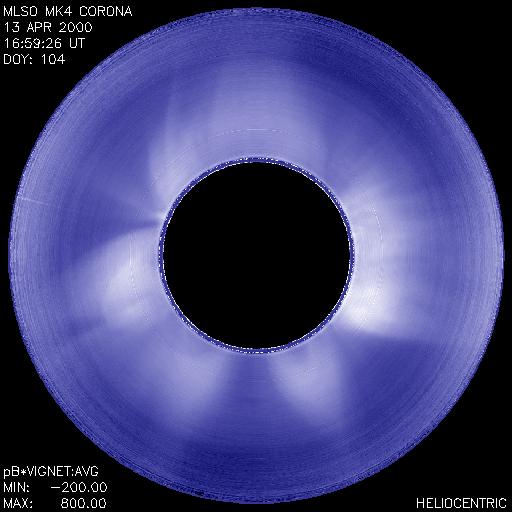
April 13, 2000 (East limb)
| length lower limit = 1 days
visible in white light at limb April 13;
| |
| Recurrence =West limb March 27***; March 30**; East limb April 13; Also visible Sep-Dec 1999 | |
| Evolution comments = Part of 8 month supersystem -- but other limb from other Feb-Apr piece. Also visible March 14,16... West limb -- many other days. Possible eruption April 15 -- but no Mk4 data -- and may be too far from pole. System probably exist longer than shown here. At least two Mk4 eruptions, Feb 5 and Mar 3. |
| Neutral line orientation at the limb = | |
| CME/dimmings association =
CME March 3 (also Feb 5); prominence eruption on March 3; | |
| Active region association =
N/A | |
| Filament/FC association = PCF-S; polar crown filament | |
| Other comments:
N/A | |
| Filament -
only visible in H-alpha or EUV
| |
| Necking -
no neck
|
Cavity list (e.g. Tables 2 + 3)
Full list of cavity days observed
List of best cavity days (SET 1) observed (e.g. Table 1)
CMEs associated with cavities (e.g. Tables 7 + 8)
BACK TO TOP