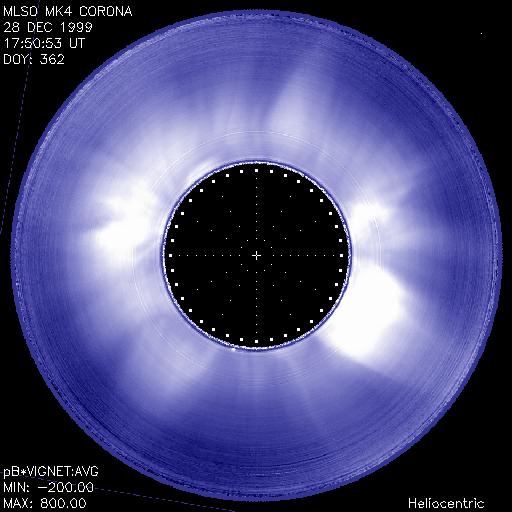
December 28, 1999
| length lower limit = 2 days
visible in white light at limb December 26***; -28 (LASCO/EIT CME (29)!);
| |
| No Recurrence analyzed | |
| Evolution comments = Angled CF-S -- originally mistaken for part of Sept - Dec 99 cavity system, but turns out higher latitude, related to different filament channel. Nice and bulbous cavity Dec 26. Bad Mk4 data Dec 27, poss visible 28, gone 29 -- and indeed, the PCF appears to erupt in EIT and LASCO on Dec 29. Too early for Mk4, unfortunately. |
| Neutral line orientation at the limb = | |
| CME/dimmings association =
CME LASCO December 29; prominence eruption on December 29; | |
| Active region association =
N/A | |
| Filament/FC association = Angled CF-S; Angled CF-S | |
| Other comments:
N/A | |
| Filament -
only visible in H-alpha or EUV
| |
| Necking -
bulging neck
|
Cavity list (e.g. Tables 2 + 3)
Full list of cavity days observed
List of best cavity days (SET 1) observed (e.g. Table 1)
CMEs associated with cavities (e.g. Tables 7 + 8)
BACK TO TOP