From Judge (1998).
NCAR lead P. G. Judge (HAO)
No sensitive spectral survey of the line spectrum of the solar corona has been made beyond 1.6 microns. Previous work indicates the presence of forbidden transitions in coronal ions from 2 to 10 or even 20 microns. Such lines, if sufficiently bright, can be used to diagnose magnetic fields in coronal plasma using new telescopes such as the ATST, scheduled for commissioning in 2019. A spectral survey will also reveal permitted transitions from cool plasma (e.g. prominences) present at coronal heights, also of significant diagnostic interest. Measurements of magnetic fields above the Sun's surface are badly needed to understand the origins of solar activity and terrestrial infliuences.
We argue that the 21 August 2017 eclipse over the mainland USA presents an almost ideal opportunity to perform such a spectral survey. Further, we suggest that the NCAR HIAPER aircraft, when equipped with a modest suite of instruments, is a ready-made platform from which to conduct several cutting-edge experiments. HIAPER can accomodate several experiments through the infrared and optical ports in the top of the fuselage. Fourier transform spectrometers routinely used at ACD, NCAR can readily be augmented to obtain the needed IR spectra.
By flying near 50,000 ft, the atmosphere is largely transparent above 310 nm (the Hartley band O3 cutoff) to 20 microns and beyond. Clouds/weather are avoided entirely.
By flying with the jetstream along the moon's shadow path, totality and the flash spectrum can be extended by over 40%.
We review some scientific questions which might be addressed, assess the relative merits of HIAPER as an aircraft platform, and propose some instrument configurations which might serve to address some pressing questions.
We believe that a "clean" infrared coronal spectral survey of the Sun between 2 and 10 microns should have the highest scientific priority, with a goal of extension to 20 microns. One of two starboard side ports, each of 15x22.5 cm clear aperture with normal oriented at 18 degrees to the vertical, could be used with an IR FTS instrument and dedicated off-axis telescope.
We suggest other observations that might be made through the other starboard port as well as the 52cm circular optical port looking vertically upwards from the aircraft.
Plasma Physics. The solar corona is the largest low-beta (beta = ratio of gas to magnetic pressure), nearly ideal plasma that is directly observable with high angular resolution (pixels less than 1/1000th of the apparent size of the plasma). It is a rosetta stone for examining the physics of plasmas on large scales with very little dissipation. Problems of broad interest in plasma physics include stability, turbulence, anisotropic transport processes, dynamos, plasma heating, reconnection, among others. While we have observed the coronal plasma since antiquity (during total eclipse), we have very few measurements of coronal magnetic fields. Since the coronal magnetic field dominates the stresses and energy density, by observing only the plasma we therefore tend to observe only the end result of instability, turbulence etc., instead of their root causes. By observing changes in, for example, magnetic toplogy directly, we can hope to obtain answers to questions such as, what causes a particular solar flare?
Effects of the Sun on the earth. Geoeffective phenomena, such as flares and Coronal Mass Ejections (CMEs), are caused by the storage and release of free magnetic energy in the Sun's corona ( Low 1994 ) While the energy for these processes is injected from beneath the corona, as the Sun's internal magnetic field naturally evolves in concert with the differentially rotating and turbulent plasma, the nature of the stored coronal energy is essentially unknown. Do large "ropes" of magnetic flux emerge intact, loaded with free energy (sheared and twisted fields), or is there also a build up of energy that results from the shearing and rotating motions at and beneath the solar surface?
Solar physics is an observationally-led science . Before predictive models can be developed, we must first attempt to measure the magnetic field in coronal plasmas remotely. There are a few -- difficult -- options available. Infrared coronal emission lines are potentially sensitive probes of components of the coronal vector magnetic field- the sensitivity to field strength varies in proportion to wavelength, via the Zeeman effect. Infrared coronal lines usually arise from magnetic dipole ("M1") transitions between levels of the ground terms in elements with several p electrons. When M1 lines are excited anisotropically, such as by infrared radiation from the photosphere below, the polarized light scattered by them becomes sensitive to the direction of the magnetic field, projected onto the plane of the sky.
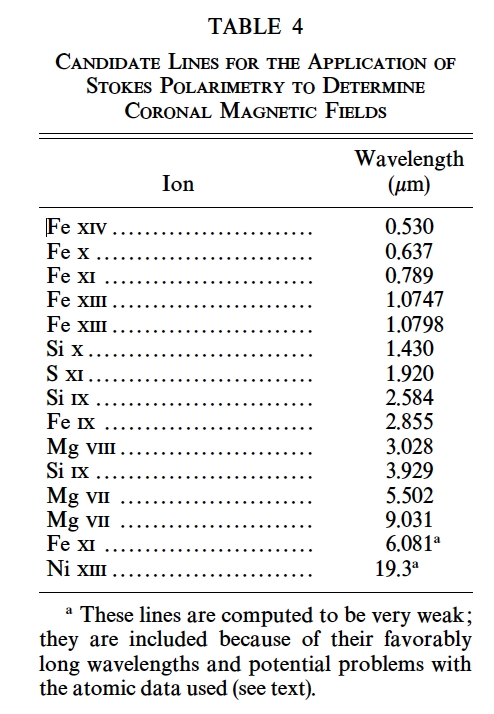
Of the brightest infrared M1 lines, only those at 1.0747, 1.0798, 1.43 and 3.93 microns have been definitively detected in the Sun's coronal spectrum . In order to determine once and for all which are the most favorable lines for measuring coronal magnetic field, it is critically important to obtain data between 2 and 10 microns, the "sweet spot" in wavelength for coronal M1 lines.
The ATST project, a $300M investment in ground based solar physics by the United States, is under construction and is scheduled to begin operations in 2019. It is a 4m coronagraphic telescope, and the world's largest solar telescope. (A coronagraph is a special telescope designed to see the solar corona, typically 1 million times dimmer than the solar surface). ATST's first generation instruments extend only to 5 microns. A large part of the science justification for ATST is its coronal capabilities, meaning more specifically, the coronal magnetic field. It will be important to determine those M1 transitions beyond 5 microns, if any exist, which are strong enough to provide motivation to develop second generation of instruments to diagnose the solar corona's magnetic field with the world's biggest solar telescope.
The need for UV/visible data during eclipse. There are several scientific reasons to explore spectra in the near UV region in the corona and prominences during eclipse. These might include deep spectral surveys and imaging of coronal structures at sub arcsecond angular resolutions.
There is one particularly long-standing puzzle in the solar corona: here we call it the "red line versus green line" coronal problem. The "red line" of Fe X near 0.637 microns (see the above table) forms near 1 million K; the "green line" of Fe XIV (0.530 microns) near 2-3 million K. The red line images are always sharper than green line images, which appear "fuzzy". This effect is of solar origin, as confirmed in much later EUV and soft X-ray data.
Most coronal research ignores this problem, since in principle its interpretation involves difficult issues such as cross-field transport, unresolvably small reconnection events and MHD turbulence. The problem is that the Sun is really trying to tell us something important about such issues which are critical in a wide variety of plasmas, both in the laboratory and in space. For example, star formation is especially sensitive to the physics of these processes. Under these conditions it is important to obtain solar data of the highest possible quality in a selection of representative atomic species. As we argue below, some observations of the corona from high altitude at the near UV wavelengths might help answer this problem- there are many spectral lines that would appear useful.
There may be reasons to look farther into the infrared , but with Judge's (1998) work on forbidden lines, the line spectra of sufficient brightness would have to be electric dipole (E1) transitions between high-n levels of various ions, perhaps even neutral species formed in cooler, prominence structures. A n=9 to n=8 transition in hydrogen lies near 28 microns, for example. However, even at coronal plasma densities, these transitions will tend to be quenched by collisions. For example, from e.g. Fujimoto 2004, the maximum principal quantum number n for which radiative decay dominates collisions is near 94 (ne/z7)-2/17., where ne is the electron density in cm-3 and z is the nuclear charge of the atom. In prominence plasma, for example, with ne = 1010, z=1, then n is 6. This means that the 28 micron lines would be strongly collisionally quenched and very weak.
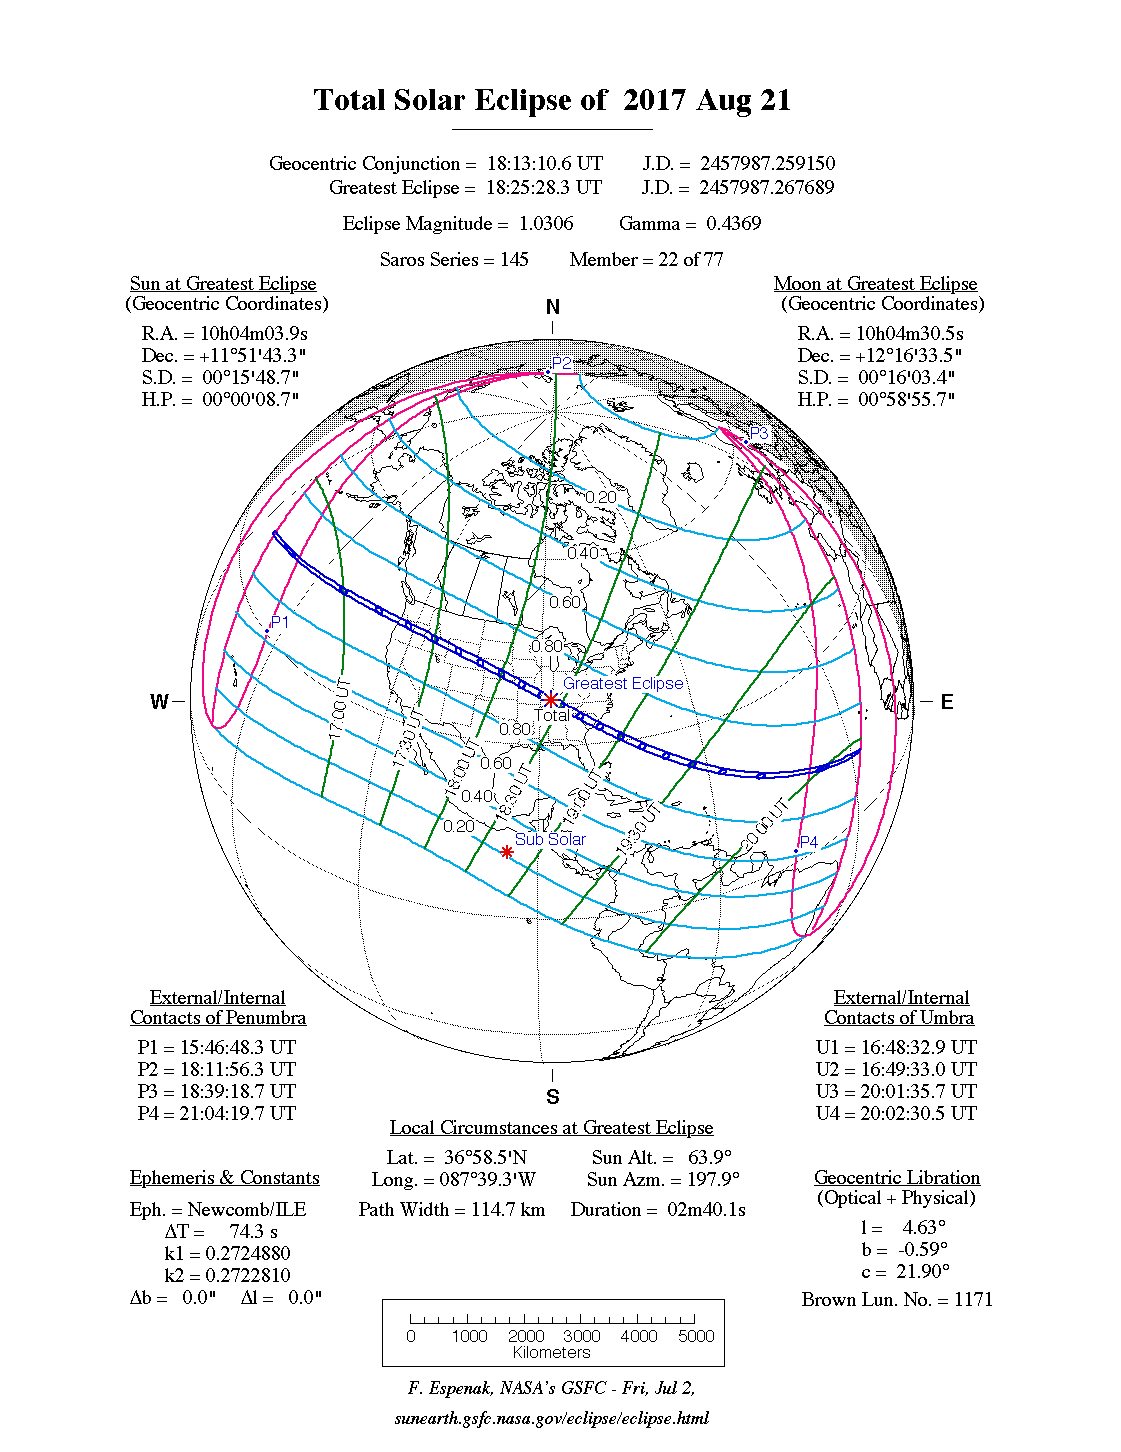
Fred Espenak of NASA computes elements for eclipses, his page for the 21 August 2017 eclipse is here .
|
Here is a a map of the circumstances of eclipse. The point of maximum eclipse (ME) is in Kentucky, some 140 km to the NW of Nashville KY.
|
|
| Conditions at maximum eclipse | value | comment |
|---|---|---|
| Time (UT) | 18:25:28.3 | |
| Local tIme (CDT) | 13:25:28.3 | |
| Duration of eclipse | 2m 40.1s | |
| Duration of eclipse for parallel shadow ground speed, of 850 kph. There is a trade off between aircraft altitude and air speed. | 3m 50s | 850 kph is mach 0.8. Maximum GV allowable speed is mach 0.885, at 35,000 ft |
| Latitude | 36deg 58.5min N | |
| Longitude | 087deg 39.3min W | |
| Eclipse magnitude | 1.0306 | |
| Solar altitude | 63.9 degrees | 26.1 degrees zenith distance |
| Solar azimuth | 197.9 degrees | 17.9 degrees W of S |
| Width of eclipse track | 114.7 km | |
| Speed of shadow along shadow track | 2790 kph | computed from differential central shadow motion by PGJ |
| Heading along shadow track | 113.4 degrees | ditto |
A series of experiments along the shadow track on the ground could in principle obtain useful IR spectral data. However, there are significant advantages to observing from a platform above 13 km altitude.
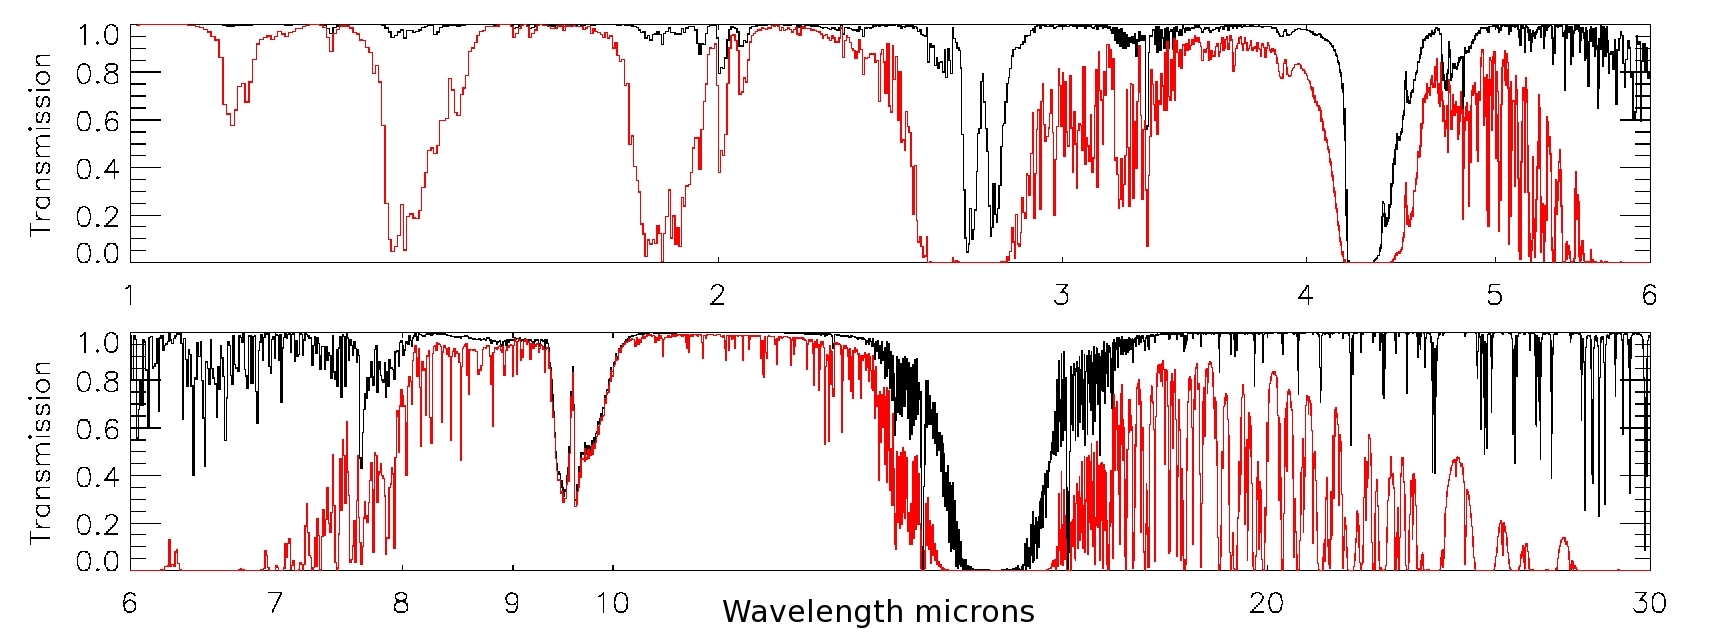
| This is a plot showing the atmospheric transmission for SOFIA (black) at an altitude of 41K feet and 7.3 micron of precipitable water vapor compared to Mauna Kea (red) at an altitude of 13.8K feet and 3.4 mm water vapor over the range of 1 to 30 microns. The transmission was calculated using the ATRAN code with a telescope zenith angle of 45 degrees, and the data were smoothed to a resolution of R=2000 |
|
These advantages dictate the use of balloons or aircraft or space vehicles. Balloons are subject to drift, space vehicles expensive. Thus, we believe that a high altitude aircraft is an excellent platform from which to conduct the desired science experiments.
SOFIA is an observatory for infrared astronomy flying up to 45,000 ft, equipped with a 2.5 m diameter main mirror and a variety of instruments. A superficial glance at this observatory's capabilities might suggest that it is a good match for the science questions posed above.
However, a closer look reveals significant challenges for observations of solar eclipses, in particular for those in which the shadow track of the moon is in the Northern hemisphere, such as that of the 17 Aug 21 eclipse of 2017:
SOFIA is better suited to observing an eclipse when a lunar shadow track is in the S. hemisphere, when the elevation of the Sun lies between 20 and 60 deg, and such that the shadow track happens to lie perpendicular to the solar azimuth direction during totality. There are two upcoming eclipses, one in Jul 02 2019 with a mid eclipse sun elevation of 49.6 degrees that appears very well suited to SOFIA, but whose mid eclipse point is in the S. mid Pacific. The other in 2020 is more favorably placed over land but has at mid eclipse an elevation of 72.7 degrees. See Fred Espenak's eclipse web page for the decade 2011-2020
HIAPER is one of many research aircraft worldwide. It is well suited to the 2017 eclipse, since it has been outfitted with various optical and IR transmitting ports. From this platform, users already observe the bright solar disk as a source to measure the Earth's absorption line spectrum.
Here is a link to the useful NSF/NCAR GV Investigator Handbook
The use of HIAPER hinges on the availability of suitable ports behind which instruments can be deployed during eclipse. The figure (figure 2.2 from the above handbook) shows the upper fuselage.
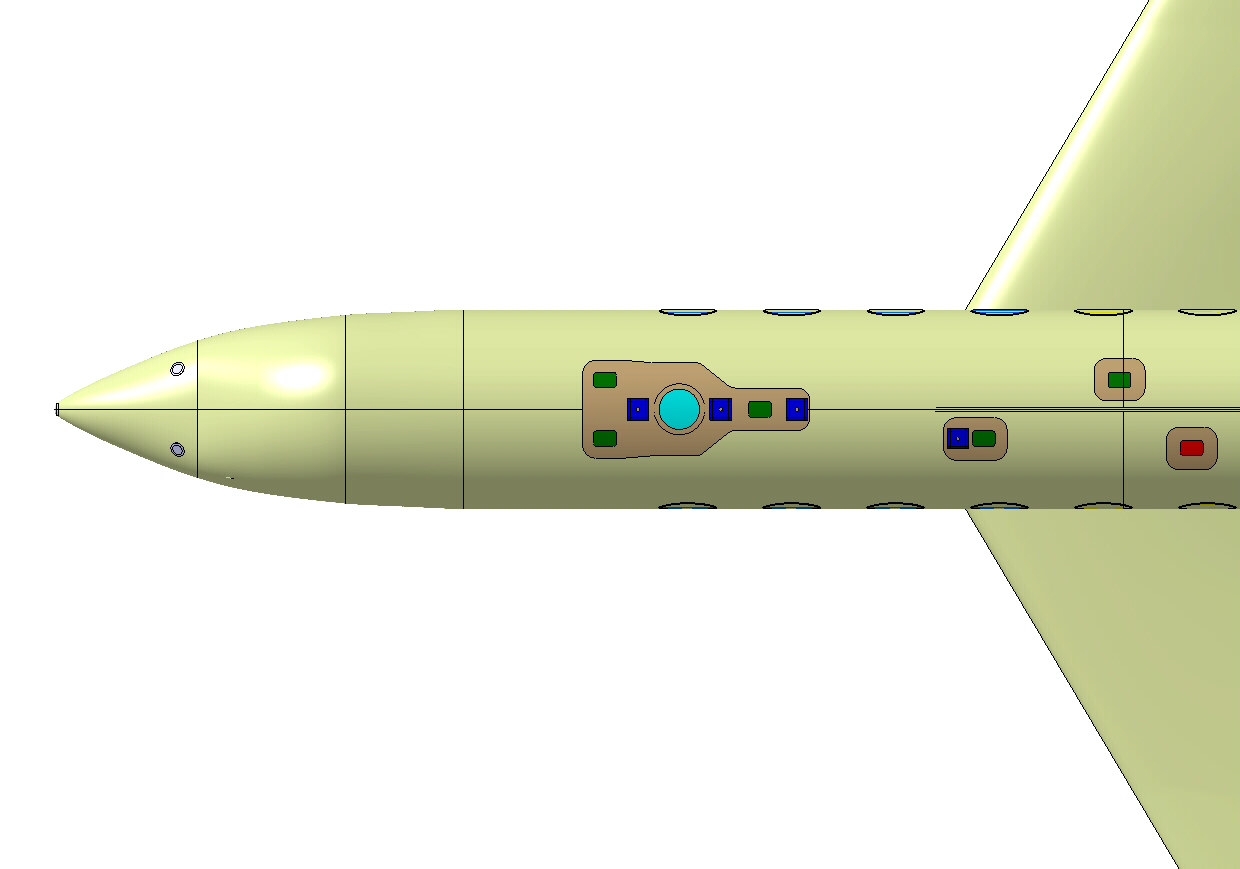
Figure 2.2 from the GV Investigator's Handbook. The optical view port is shown in light blue. The infrared ports are the four (???) oval shaped ports in red (???). Those on the starboard side of the fuselage are most suited to observations of the 21 August 2017 total solar eclipse.
Infrareds port of ZnSe were installed in 200?, these have high transmissions from around (0.45 to 21.5 microns). These ports are labeled by EOL as "-03". ??? THESE SHOULD BE MARKED ON THE FIGURE???
SiO2 ports, which transmit from below 300 nm to a few microns, have also been installed. One such port is labelled "-01".
The main optical port transmits light from ???nm to ??? nm.
The Atmospheric Chemistry Division (ACD) of NCAR has two infrared Fourier Transform Spectrometers (FTS) for use on the GV. The first is an instrument used and modified by Bill Mankin (ex-ACD). A description of this instrument, as of 1977, can be found here . This FTS has been modified since then, including several improvements. It has a tip-tilt mechanism for tracking bright sources. Typically it has been used to observe the absorption of the earth's atmosphere using the bright solar disk as a light source, close to sunrise or sunset. It has a laser source for wavelength calibrations.
The second is a new instrument. It would be nice to have information on this instrument from ACD.
total photon fluxes from the entire corona and integrated over the wavelengths contributing to the line emission are between 1.e6 and 1.e8 for the computed lines, in ph / cm2/s, immediately above the earth's atmosphere:
These are CRUDE estimates, probably a bit better than order of magnitude estimates.
| Ion | lambda | wavenumber | Log T max | Flux | Absorber | Transmission @ 8 km |
| micron | cm-1 | K | ph/cm2/s | % | ||
| Fe XIV | 0.530 | 1.885E+4 | 6.30 | 2.6E+8 | none | 100 |
| Fe X | 0.637 | 1.568E+4 | 6.03 | 1.8E+8 | none | 100 |
| Fe XI | 0.789 | 1.267E+4 | 6.10 | 1.5E+8 | none | 100 |
| Fe XIII | 1.075 | 9.305E+3 | 6.22 | 4.9E+8 | none | 100 |
| Si X | 1.430 | 6.993E+3 | 6.13 | 1.6E+8 | H2O | 50 |
| S XI | 1.920 | 5.208E+3 | 6.25 | 3.6E+7 | H2O | 50 |
| Si IX | 2.584 | 3.870E+3 | 6.04 | 6.1E+7 | H2O | 0 |
| Fe IX | 2.855 | 3.503E+3 | 5.94 | 1.6E+7 | H2O/CO2/N2O | 60 |
| Mg VIII | 3.027 | 3.303E+3 | 5.92 | 2.7E+7 | H2O +0.6cm-1 | 100 |
| Si IX | 3.935 | 2.545E+3 | 6.04 | 5.7E+7 | N2O | 60 |
| Mg VII | 5.502 | 1.818E+3 | 5.80 | 3.2E+6 | H2O | 10 |
| Fe XI | 6.081 | 1.644E+3 | 6.10 | 2.6E+6 | H2O | 50 |
| Mg VII | 9.031 | 1.107E+3 | 5.80 | 9.5E+5 | O3 | 90 |
For an aperture of radius r [cm] the number of photons entering
a spectrometer in each line is then pi r^2 * flux. For a 1 mm diameter
aperture we would have something like 3.e4 to 3.e6 photons/s  in each line.


Table 4 of Judge et al 2000 (NCAR TN 446), in ASCII, is edited and
listed above.  Coronal line photon fluxes (photons/cm2/s) from entire
corona integrated over the emission line of width 1.e-4 * wavelength
(Doppler width of 30 km/s), at earth, calculated from
 2 pi Rsun H * Intensity / (1 AU)^2

Rsun = solar radius = 7.e10 cm
H = thermal scale height of the corona = 5.e9 cm
1 AU = astronomincal unit = Sun-earth distance = 1.5e13 cm
I = intensity of radiation from corona in photon units.  Example:

CHECK:
From Judge 1998, Si IX 3.93 microns has log I = -0.17, I = 0.67  erg/cm2/s/sr,
hc/(3.93e-4) = 5.e-13 erg, so

Intensity = 1.3e+12 ph /cm2/s/sr

Now the factors Rsun, H and AU are simply the angular diameter of the ring around the sun.

Then we find FLux (ph/cm2/s) in the table as 1.3e+7

But Judge's numbers correspond to intensities 1.1 Rsun and higher above
the limb.  If we assume the brightness increases as exp( -z/H) above the limb
the total intensity from the entire corona down to 1 Rsun would be
exp(+ 0.1Rsun/H) higher or a factor of 4 higher, in agreement with
the table.

CONVERSION TO PHOTONS/UNIT (wavelength or wavenumber)

To get photons/cm2/s per unit wavelength or wavenumber dFlux/dwavenum,
say, at the peak of the line emission, we would have

dFlux/dLambda = Flux / (1.e-4 * lambda)
                          = FLux * wavenum * 1.e4

dFLux/dwavenum = dFLux/dLambda * dLambda/dwavenum

                              = dFlux/dLambda * (-1/wavenum^2)
                               = Flux *1.e4 / wavenum     (take absolute value)

P. Judge
14 Oct 2013
back to top
|
The GV is equipped with a 52cm diameter vertically-looking optical
view port. If flying level at maximum eclipse, the solar elevation
angle is 64 degrees, so that the 52cm aperture is foreshortened to an
ellipse of 47 x 52
cm. (At the 90% duration points the aperture is foreshortened to 43.6x52
and 44.6x52 cm respectively). It also has some fused silica
SiO2 ports providing transmissons to below the UV
cutoff near 320 nm. These are mounted with normals at 18 degrees from the vertical
direction, so that those on the starboard side coulr more readily
observe the eclipsed Sun. ???
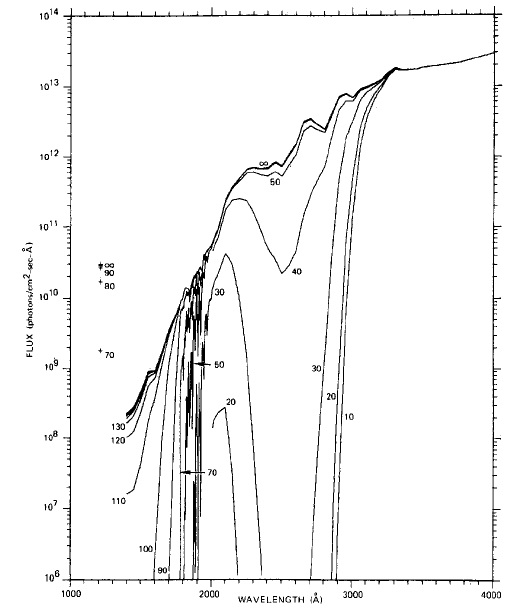
The UV cutoff due to ozone is near 320 nm. The figure is from Huffman (1985) showing the solar UV flux as a function of wavelength [Angstroms, 1 Angstrom = 0.1 nm] and observing height [km] for a 60 degree solar elevation. At this wavelength a 30cm diameter telescope observing close to UV cutoff of 320nm gives an angular resolution near 0.27 seconds of arc . The highest angular resolution images ever obtained of the corona are ~ 0.2 arcseconds, obtained in 2012 in one EUV line (Fe XII 19.3 nm) by the Hi C team led by J. Cirtain. The highest resolution observations obtained of the corona during eclipse are about 0.4 seconds of arc, determined by the atmospheric seeing on Mauna Kea in 1991 (November & Koutchmy 1996) |
|
Below is a representative list of spectral features above the UV cutoff that might offer comparable views of the solar corona using narrow band imaging filters, if the seeing due to aircraft turbulence is small and/or could be removed (for example, using speckle techniques). (???It is not clear what the seeing from an aircraft flying subsonically along the moon's shadow will be. ???)
LINES FOR IONS THAT ARE AT LEAST 4X IONIZED . These are essentially all magnetic dipole or electric quadrupole forbidden transitions. Note that a line of Fe XIII at 338.872 nm might be a nice choice, or Fe X 345.396 nm. although the associated levels lie near 50eV for this line .
Lines for 0-3x ionized ions . These are nearly all electric dipole transitions, they should be strong in prominences.
The shadow path of totality most likely will be affected by the jetstream. There are positives and negatives to this
| The figure shows Cn2 for average conditions. The integral of this quentity with height enables one to estimate the "seeing"- the effects of the turbulent atmosphere on the images obtained with telescopes of point sources. There are basically two major components to the turbulence - the first is usually dominant when observing from the ground, it is the "-4/3 power law" shape in the figure, originating from the air/surface boundary layer . But when observing from high altitudes up to say 15 km, and in the absence of turbulent flow around an aircraft , the second component remains- it is turbulence associated with the mid latitude jetstream. On average this peaks near 10 km altitude and drops steeply with height. If HIAPER were to fly at 15 km, it would seem that the bulk this turbulent layer might be expected to be absent. |
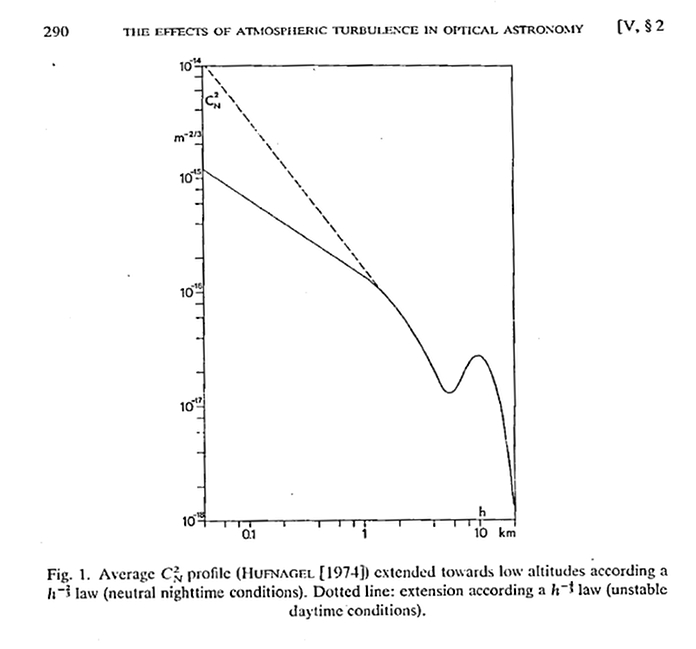
Figure 1 from Roddier 1981, showing the variance in refractive index as a function of height in the earth's atmosphere, "Cn2". |
To see how much turbulence might be expected to affect seeing from a high altitude aircraft, we have at least one reference data set (this was kindly provided by Karsten Schindler of the SOFIA project. He says: "The SOFIA telescope is located in a cavity beyond the plane's bulkhead (at stratospheric conditions), so it looks straight out of a hole in the fuselage in flight. There, seeing in the visible and "near" infrared is mainly dominated by the shear layer over the telescope cavity. There is also a smaller component due to air motions inside the cavity. Beyond ~20µm, seeing is diffraction limited and the shear layer not important anymore. See the following graph from Erickson & Dunham (2000)":
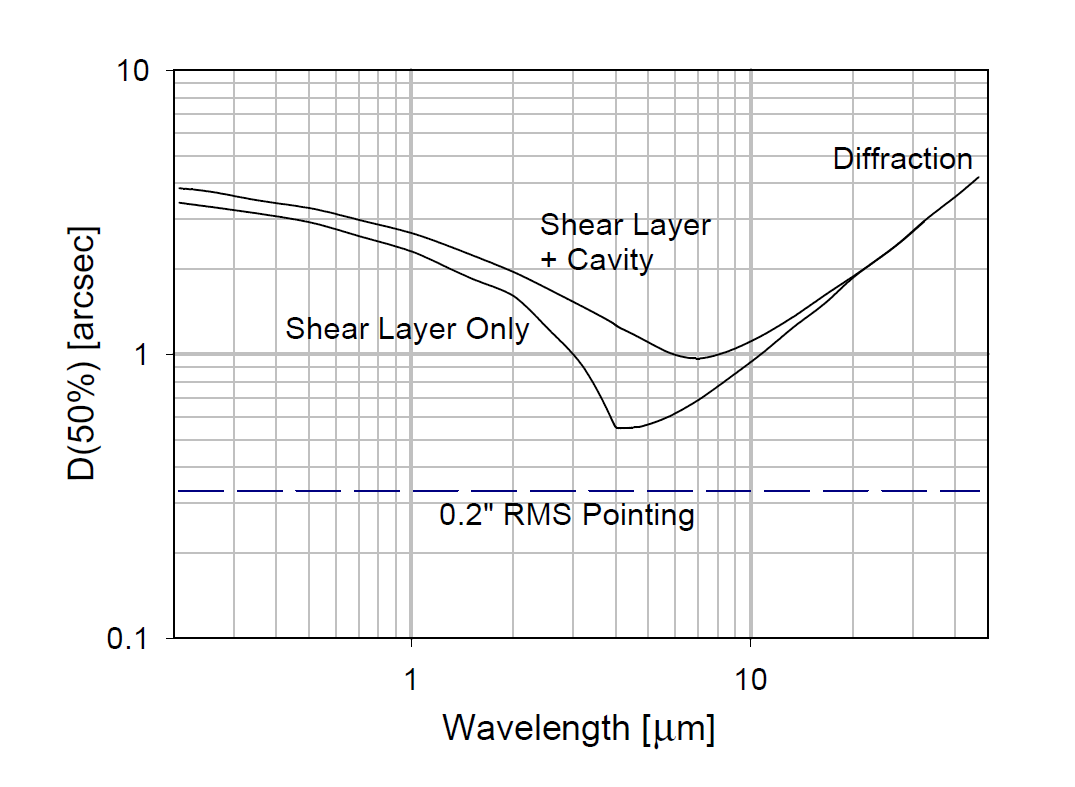
Seeing at SOFIA from Erickson & Dunham 2000. Notice that the shear layer dominates at visible and UV wavelengths.
Karsten continues "seeing should be much better from an aircraft window than predicted for SOFIA's cavity, as you have a laminar flow over the fuselage there, not a shear layer."
Karsten also points out that "Planning aircraft observations you should consider inertial platforms; I remember that the Gulfstream V's autopilot did automatically roll the plane with a ~4-5s period; and the amplitude of this rolling motion was enough to mess up any star images that we tried with a 135mm lens on an unstabilized ccd camera of that time (we used a 28mm lens to have no star trails!).... Apart from that there are vibrations. If you cannot do lucky imaging e.g. due to narrow-band filters or flux limitations you should try to inertially stabilize the camera somehow."
This presents us with the interesting possibility, not without technical challenges, of obtaining very high angular resolution images of the corona through narrow-band interference filters, at near UV and visible wavelengths.