Note
Benchmark results (pdf plot files) for version tiegcm2.0 are available here: Post-processing of TIEGCM benchmarks
A series of benchmark runs are made for each major release of the tiegcm These runs (for tiegcm2.0) were made using the python scripts in the tgcmrun/ directory.
Netcdf files with the first history of each benchmark run are available in the data download file. These files can be used as start-up SOURCE files to reproduce the runs.
Benchmark runs are provided in three groups: full-year climatology, seasonal, and solar storm events. Here is a table of runs at 2.5-degree model resolution (there is also a set at the 5-degree resolution):
Full-year climatologies (solar min,max):
  tiegcm_res2.5_climatology_smax       Full-year climatology at solar maximum conditions
  tiegcm_res2.5_climatology_smin       Full-year climatology at solar minimum conditions

Seasons (Equinox, Solstice, solar min,max):
  tiegcm_res2.5_decsol_smax            December Solstice, solar maximum (days 355-360)
  tiegcm_res2.5_decsol_smin            December Solstice, solar minimum (days 355-360)
  tiegcm_res2.5_junsol_smax            June Solstice, solar maximum     (days 172-177)
  tiegcm_res2.5_junsol_smin            June Solstice, solar minimum     (days 172-177)
  tiegcm_res2.5_mareqx_smax            March Equinox, solar maximum     (days 80-85)
  tiegcm_res2.5_mareqx_smin            March Equinox, solar minimum     (days 80-85)
  tiegcm_res2.5_sepeqx_smax            September Equinox, solar maximum (days 264-269)
  tiegcm_res2.5_sepeqx_smin            September Equinox, solar minimum (days 264-269)

Solar storm events (Heelis/GPI and Weimer/IMF,GPI):
  tiegcm_res2.5_dec2006_heelis_gpi     December 2006 storm, Heelis/GPI          (days 330-360)
  tiegcm_res2.5_dec2006_weimer_imf     December 2006 storm, Weimer/IMF,GPI      (days 330-360)
  tiegcm_res2.5_jul2000_heelis_gpi     July 2000 storm,     Heelis/GPI          (days 192-202)
  tiegcm_res2.5_jul2000_weimer_imf     July 2000 storm,     Weimer/IMF,GPI      (days 192-202)
  tiegcm_res2.5_nov2003_heelis_gpi     November 2003 storm, Heelis/GPI          (days 323-328)
  tiegcm_res2.5_nov2003_weimer_imf     November 2003 storm, Weimer/IMF,GPI      (days 323-328)
  tiegcm_res2.5_whi2008_heelis_gpi     Whole Helio Interval 2008 Heelis/GPI     (days 81-106)
  tiegcm_res2.5_whi2008_weimer_imf     Whole Helio Interval 2008 Weimer/IMF,GPI (days 81-106)
Note
Seasonal runs and full-year Climatologies were run with constant solar forcing, as follows:
POWER = 18.CTPOTEN = 30.F107 = 70.F107A = 70.
POWER = 40.CTPOTEN = 60.F107 = 200.F107A = 200.
For comprehensive plots of all benchmark runs, please see the TIEGCM2.0 Release Documentation
Seasonal (equinoxes, solstices, solar min, max):
- decsol: December Solstice (days 355-360)
- junsol: June Solstice (days 172-177)
- mareqx: March Equinox (days 80-85)
- sepeqx: September Equinox (days 264-269)
Climatologies (full-year runs with daily histories):
- climatology_smax: Climatologies at Solar Maximum
- climatology_smin: Climatologies at Solar Minimum
December, 2006 “AGU” Storm Case (days 330-360):
- dec2006: Heelis potential model with GPI (Kp) data
- dec2006: Weimer potential model with IMF data (F10.7 from GPI)
November 19-24, 2003 Storm Case (days 323-328)
- nov2003: Heelis potential model with GPI (Kp) data
- nov2003: Weimer potential model with IMF data (F10.7 from GPI)
July 11-21, 2000 “Bastille Day” Storm Case (days 192-202)
- jul2000: Heelis potential model with GPI (Kp) data
- jul2000: Weimer potential model with IMF data (F10.7 from GPI)
Whole Heliosphere Interval (WHI) (March 21 to April 16, 2008)
- whi2008: Heelis potential model with GPI (Kp) data
- whi2008: Weimer potential model with IMF data (F10.7 from GPI)
Note
For more detailed information and access to history file output, and extensive post-processing of these runs, see the TIEGCM2.0 Release Documentation
The tgcmrun directory under the model root directory (modeldir) contains Python code that semi-automates submission of selected benchmark model runs on the NCAR supercomputer system (yellowstone). The tgcmrun command can be executed interactively on the command line, or from a shell script. Type “tgcmrun -h” on the command line for a detailed usage message. Typing “tgcmrun” on the command line will cause the program to print the available benchmark runs and prompt the user as follows:
The following runs are available:

NUMBER NAME            DESCRIPTION
------ ----            -----------
0      default_run     Default run
1      decsol_smax     December Solstice Solar Maximum
2      decsol_smin     December Solstice Solar Minimum
3      junsol_smax     June Solstice Solar Maximum
4      junsol_smin     June Solstice Solar Minimum
5      mareqx_smax     March Equinox Solar Maximum
6      mareqx_smin     March Equinox Solar Minimum
7      sepeqx_smax     September Equinox Solar Maximum
8      sepeqx_smin     September Equinox Solar Minimum
9      nov2003_heelis_gpi      November 2003 storm case, Heelis potential model, GPI data
10     nov2003_weimer_imf      November 2003 storm case, Weimer potential model, IMF, GPI data
11     dec2006_heelis_gpi      December 2006 "AGU storm", Heelis potential model, GPI data
12     dec2006_weimer_imf      December 2006 "AGU storm", Weimer potential model, IMF and GPI data
13     whi2008_heelis_gpi      2008 "Whole Heliosphere Interval", Heelis potential model, GPI data
14     whi2008_weimer_imf      2008 "Whole Heliosphere Interval", Weimer potential model, IMF, GPI data
15     jul2000_heelis_gpi      July 2000 "Bastille Day" storm, Heelis potential model, GPI data
16     jul2000_weimer_imf      July 2000 "Bastille Day" storm, Weimer potential model, IMF, GPI data
17     climatology_smin        Climatology run with constant solar minimum conditions (Jan 1-5)
18     climatology_smax        Climatology run with constant solar maximum conditions (Jan 1-5)

Enter number of desired run (0-18) ('q' to quit, 'p' to print list, default=0):
At this point the user can enter an integer 0 to 18, specifying the desired run. The user will then be prompted for a few additional parameters (tiegcm or timegcm model, resolution, model root directory, etc). However, it is easiest to set a few environment variables before executing tgcmrun, to minimize the need to enter long file paths at the prompt:
Source history files (start-up netcdf files with a single history) to start these runs are provided on the data download page <http://www.hao.ucar.edu/modeling/tgcm/download.php> (there are separate data downloads available for each model resolution). These source files should be located in the TGCMDATA directory (or the path may be specified in the job script with the tgcmdata shell variable).
The tgcmrun program can also be executed from a shell script. There are several example tcsh scripts in the tgcmrun directory that make series of runs for various purposes. The scripts optionally run at one or both model resolutions. History files, stdout log files, and job scripts used, are stored in a directory tree below the working directory.
Standard 18 benchmark runs (as in the interactive tgcmrun command above):
Additional runs for testing compilers, performance, etc.:
Model output history files are stored in CF-compliant netCDF format (see NetCDF History Output Files). Benchmark history files are available via Globus research data sharing service. The tiegcm benchmark history files are stored at the “NCAR Data Sharing Service” Globus shared endpoint (for users with an NCAR/CISL login: this endpoint is /glade/u/datashare/tgcm).
See these CISL docs for information regarding the NCAR Data Sharing Service:
- NCAR Data Sharing Service
- Globus file transfers (see especially “Transferring files with the webh interface”)
- Retreiving data from a shared endpoint
Here is a summary procedure for accessing the tiegcm2.0 benchmark data:
Note
You do NOT have to have an NCAR user account or token to retrieve this data.
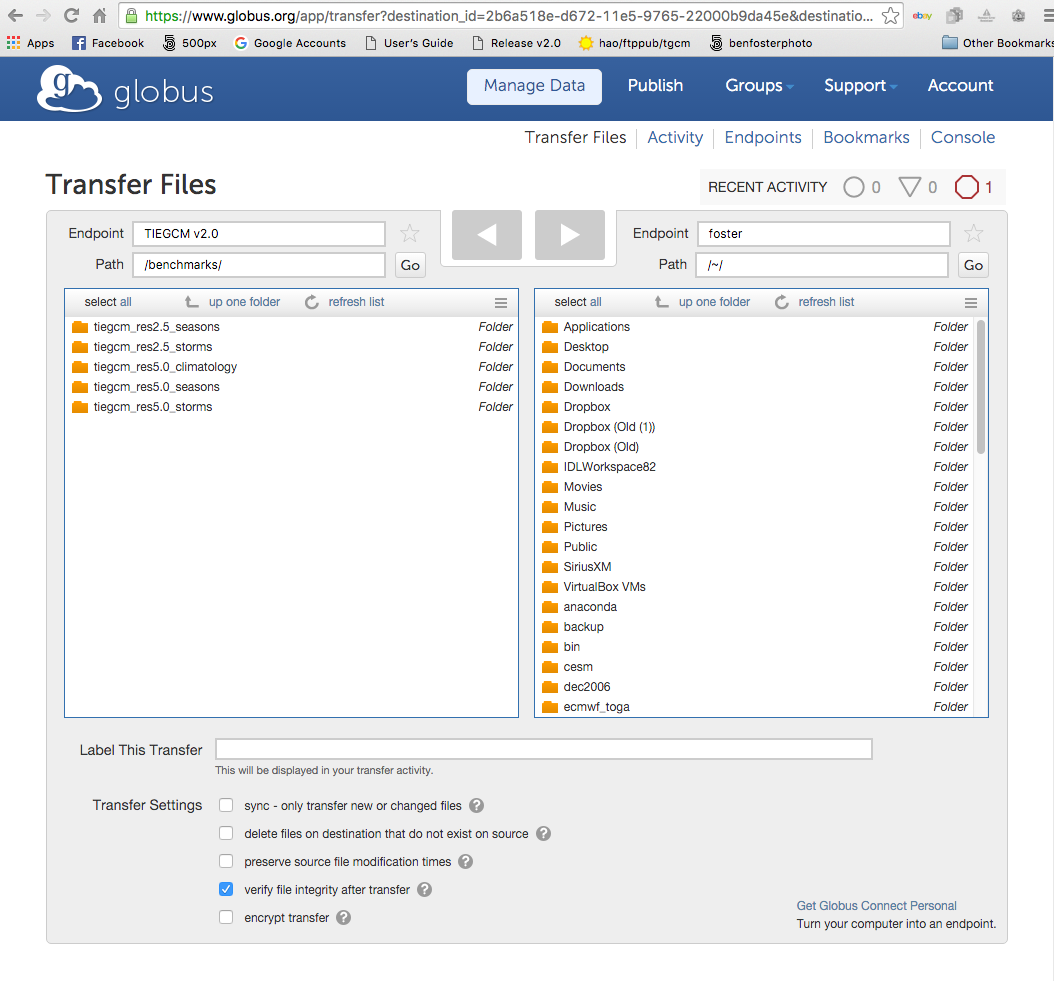
Here’s a screen shot of a Globus file transfer from the TIEGCM v2.0 endpoint to my personal Macbook Pro: Globus_screenshot.png
In each of the 6 benchmark groups are folders for each run, with folders containing the history files (hist), post-processing (proc), and scripts and log files (stdout). Individual files or whole directories can be downloaded.
Note
Users wanting to use their NCAR authentication rather than personal GlobusID, apparently need to have a login on the NCAR RDA (Research Data Archives) to access the NCAR GLADE endpoint on Globus.