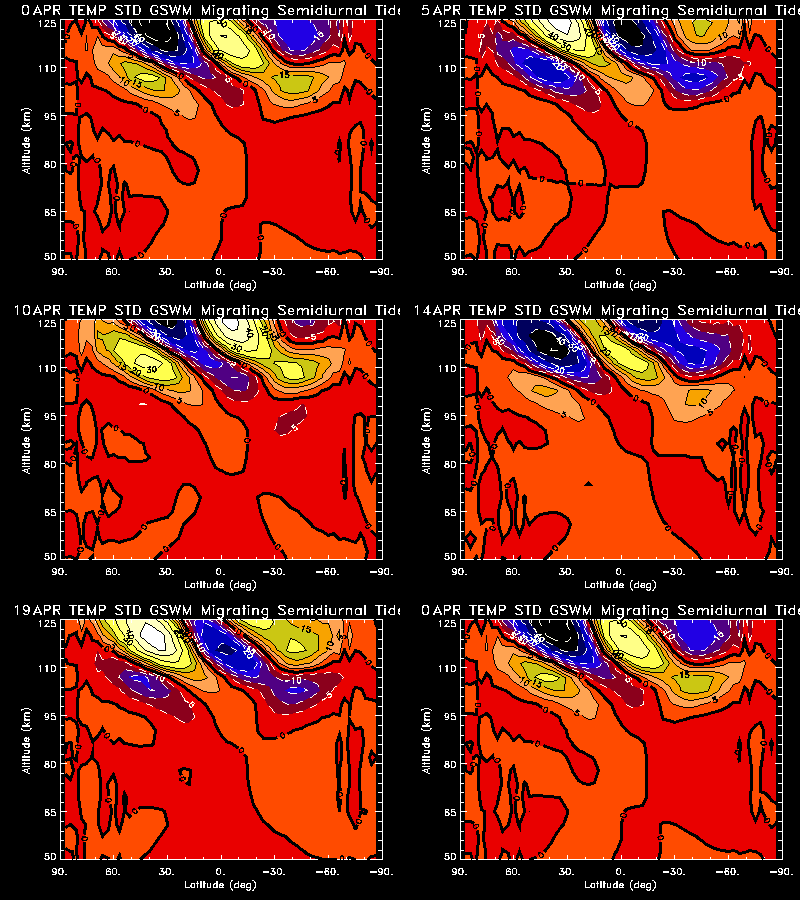
Animation cycles threee times (three solar days). [ESC] to stop, Reload to replay.

The phase velocity is downward, though the tide propagates upward with a wavelength of about 30-35km.
Note the roughly symmetric peaks about the equator at +/- 40 degrees latitude, above 100km. The phase of the tide is the same across the equator, with a peak of opposite phase and roughly equal magnitude right over the equator.
Compare with the slightly lower magnitude diurnal temperature field which begins propagating at a lower altitude over the equator.