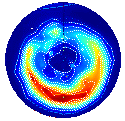
AMIE Applied to UARC Campaign, April 27th - 29th, 1998


The Assimilative Mapping of Ionospheric Electrodynamics (AMIE) procedure
(Richmond and Kamide, JGR, 5741, 1988; Richmond, Adv Space Res, 12/6, 69,
1992) relies on diverse data sets as well as on statistical models to
determine the electrodynamic properties of the high latitude ionosphere.
AMIE was run for the Northern Hemisphere (NH) every 30 minutes using 30 minute
segments or averages of data for the UARC campaign of April 27-29, 1998.

The plots we will be presenting are
(go to plots now):
I) Auroral Oval Properties:
1) Height integrated Total Pedersen Conductance with contour intervals of 2 Siemens
Plus the Pedersen Conductance Observations (NH=solid, SH=dashed)
2) Height integrated Total Hall Conductance with contour intervals of 3 Siemens
Plus the Hall Conductance Observations (NH=solid, SH=dashed)
3) Electron Energy Flux with contour intervals of 0.5 mW/m2 (0.5 erg/cm2-s)
Plus the Energy Flux Observations (NH=solid, SH=dashed)
II) Electrodynamic Properties:
4) Equivalent Current with contour intervals of 50 kA (Pos=solid, Neg=dashed)
Plus the B field Observations (star=downward delta Z, pentagon=upward
delta Z) rotated 90 degrees to be in the direction of the current (often
often opposite to the direction of the ion drift).
5) Electric Potential with contour intervals of 5 kV (Pos=solid, Neg=dashed)
Plus the E field Observations (dashed=large error bar) rotated -90 degrees
to be in the direction of the ion drift and the B field Observations
(see above).
6) Height Integrated Simple Joule heating with contour intervals of 2.5 mW/m2
where the neutral wind is assumed zero and no corrections are made for
underestimating the E field. (Pedersen conductance * E**2)
Plus the E and B field Observations (see above). The Pedersen observations
are available with the Height Integrated Pedersen Conductance.
For the data coverage plots, o's are for times before the UT time listed,
and +'s are for times after the UT time listed for satellite or scan data.
For single locations (like ground magnetometers), the data are averaged
over 30 min.
Statistical Models Used:
1) Conductance and auroral energy flux based on the Hemispheric Power
Index (HPI) from Fuller-Rowell and Evans (JGR, 7606, 1987) and mean
Maxwellian electron energies based on Hall/Pedersen ratios and
the HPI (Fuller-Rowell, private communication, 1992).
2) Weimer electric potentials based on IMF, the solar wind velocity, and
season (Weimer, GRL, 2549, 1996).
3) The first 12 hours of April 27 were run with zero electric potentials
(P=0) instead of the Weimer model.
Data Sources
The data sources are essential to get the most realistic patterns. The
statistical models are only used as a basis, and are dependent themselves
upon input data (eg, HP, IMF, Vsw). We are very grateful to have received
data from the following sources and donors:
Statistical Model Inputs:
1) HP or hemispheric power estimates from DMSP-F12, F13 and F14
These are provided by Fred Rich (
rich@plh.af.mil) of the Air Force
Research Lab. The conversion to HPI is: HPI = 2.19*ln(HP)
HPI is the basis of the auroral statistical models.
2) IMF are the GSM Bx, By and Bz values from the magnetometer on the
ACE satellite, and Vsw is the bulk speed of the solar wind from the
swepam (Solar Wind Electron Proton Alpha Monitor) on ACE. Both data
sets are taken from the on-line 1 minute digital data at the Space
Environment Center (SEC) at NOAA
(ftp://gopher.sel.noaa.gov/pub/lists/ace)
Data are averaged over 30 min, so the 30-min average IMF is the value
displayed on the plots. The IMF and Vsw are also the basis for the
Weimer statistical model.
Auroral Inputs:
1) Electron precipitation observations from DMSP-F12, F13 and F14.
These are 15 sec averages provided by Fred Rich
(rich@plh.af.mil)
of the Air Force Research Lab. These are averaged to 30 sec and
plotted with '12', '13' or '14' at the edge of the plot by the
satellite segments used.
2) Ground magnetometer deviations in H and Z from magnetometers between
50 and 78 magnetic latitude can be converted to a total (auroral
plus solar UV) conductance (Ahn et al., PSS, 641, 1983 and Ahn,
private communication, 1991). If the solar part is 50% or less,
then it is subtracted and the remaining auroral part is converted
to auroral flux and mean energy using the Robinson formulae
(Robinson et al., JGR, 2565, 1987).
3) Electron precipitation observations from NOAA-12 and 14. These
are 1 degree magnetic latitude averages provided by Susan Greer
(sgreer@sec.noaa.gov)
and Dave Evans (devans@sec.noaa.gov)
of the Space Environment Center of NOAA in Boulder. These were only
available for April 29, and are plotted with 'N2' or 'N4' at the
edge of the plot by the satellite segments used.
Magnetic (B) Field Observations and Dst:
1) 13 ground magnetometers from CANOPUS (CHU,CON,DAW,ESK,GIL,ISL,MCM,PIN,
RAB,RAN,SIM,SMI,TAL) between 60 and 79 degrees magnetic latitude in
Canada. These were provided by Terry Hughes (
hughes@dan.sp-agency.ca)
under CANOPUS rules. These data are provided by the Canadian Space
Agency. The data are gratefully received and any CANOPUS team member
is invited to be a part of this collaboration.
2) 10 ground magnetometers from USGS (BOU,CMO,FRD,FRN,GUA,HON,NEW,SIT,SJG,
TUC) in the USA and Guam between 6 and 65 degrees magnetic latitude.
These were provided by Don Herzog and Bill Green of the United States
Geological Survey.
The quiet day background used for these B observations was April 22.
The Dst used to correct for effects was taken from Kyoto University
World Data Center C (
http://swdcdb.kugi.kyoto-u.ac.jp/dstdir) for
April 22, and 27-29, 1998.
Electric (E) Field Observations:
All the E field observations were actually ion drift observations converted
using ExB at the height of the observation and moved to 110 km taking B
from the IGRF model.
1) 4-sec ion drifts from the Ion Drift Meter (IDM) on DMSP-F12 and F13.
DMSP-F14 data had problems and were not used.
These are provided by Fred Rich (
rich@plh.af.mil) of the Air Force
Research Lab. The data are averaged over 20 sec and a constant
baseline is removed from the average of data above 50 degrees magnetic
latitude. They are plotted with '12' or '13' at the edge of the
plot by the satellite segments used.
2) 2-min vectors from 4 individual HF radars (T=Saskatoon, K=Kapuskasing,
G=Goose Bay, ST=Stokkseyri) provided by Michael Ruohoniemi
(ruohoniemi@jhuapl.edu) with the permission of George Sofko (T) and
Jean-Paul Villain (ST). These data are filtered with their error bar.
These SuperDARN data are also used to determine electric potentials at:
http://sd-www.jhuapl.edu/RADAR/
3) Line-of-sight ion velocities in the central beam from the 2 CUTLASS
HF radars (P=Pykkvibaer, H=Hankasalmi) provided by Tim Yeoman
(yxo@ion.le.ac.uk).
These data are filtered and averaged over 3 scans
and 4 ranges for a minimum occurance rate of 25%. These SuperDARN
data are also used to determine electric potentials at:
http://sd-www.jhuapl.edu/RADAR/
The AMIE patterns for this UARC campaign have been brought to you by:
Barbara Emery (emery@ucar.edu),
Don Kolinski (kolinski@ucar.edu),
Gang Lu (ganglu@ucar.edu) and
Bill Roberts (bill@ucar.edu).
Go To Plots...

 Return to AMIE home page
 Return to HAO homepage.
-April, 1998.
Don Kolinski
-Copyright 1998, NCAR.


 Return to HAO homepage.