This document contains a number of visualizations pertaining to a major ionospheric storm event that occurred in November 1993. We present YOHKOH Soft X-ray data that shows possible solar influence in the event that was observed and subsequently modeled using the AMIE procedure. The procedure is used to generate a series of animations showing correlations between the observations and the computed parameters. This page also contains a list of related URLs.
The storm event timeline contains details on the IMF, satellite location, Magnetosphere, inner plasmasphere and the ionosphere during the storm period.

Contents:
The Solar Influence
Inter-hemispheric Comparison
Northern Hemisphere Electric Potential: November 2 - 11
Ionospheric Observations with Computed Parameters
Storm Event Timeline

 |
The Solar Influence - YOHKOH Soft X-ray Observations |
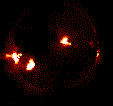
Soft X-ray data from the YOHKOH SXT were used to generate an animation (722Kb Mpeg, 3.4Mb Quicktime) covering the period October 29 through November 1, 1993. A potential CME source can be noted near the end of the animation sequence if you closely follow the bright regions in the lower left portion of the animation window. The bright vertical feature at the end of the animation is due to sensor saturation.

Electric potential patterns for the northern and southern hemispheres are displayed side-by-side.
Day 3, 12UT - 2355UT (4 Mb MPEG)
Day 4, 00UT - 2355UT (12Mb MPEG)
Day 5, 00UT - 12UT (5Mb MPEG),
Day 3,12UT - Day 5,12UT (21 Mb MPEG)

Electric potential patterns inferred by the AMIE procedure for the northern hemisphere, day 2 through day 11.
Day 2, 00 UT - Day 3, 2350 UT (10.7 Mb mpeg) , (9.5 Mb Quicktime)
Day 4, 00UT - Day 5, 2350UT (12.6 Mb mpeg) , (14 Mb Quicktime)
Day 6, 00UT - Day 7, 2350UT (11.8 Mb mpeg) , (12 Mb Quicktime)
Day 8, 00UT - Day 9, 2350UT (11.3 Mb mpeg) , (10.6 Mb Quicktime)
Day 10, 00UT - Day 11, 2350UT (11.0 Mb mpeg) , (9.8 Mb Quicktime)

The temporal and spatial evolution of observational data when combined with AMIE's computed parameters offer a method to distiguish anomalous data from valid data and to track the procedure's interpretation of these data. The animation sequences below show the correlation between:
AMIE-derived Hall conductance overlaid with Observed Hall conductance
AMIE-derived electric potential overlaid with electric field observations
AMIE-derived downward field aligned currents
AMIE-derived horizontal currents
4 panel animations
November 3:14:20 - November 4:00:00 UT (2.8 Mb MPEG), (1.4 Mb Quicktime)
November 4:00:10-4:10:10 UT (3.8 Mb MPEG), (1.9 Mb Quicktime)
November 4:10:20-4:20:10 UT (3.8 Mb MPEG), (1.9 Mb Quicktime)
November 4:20:20-November 5:06:10 UT (3.0 Mb MPEG), (1.6 Mb Quicktime)
November 5:06:20-5:16:10 UT (3.3 Mb MPEG), (1.7 Mb Quicktime)
November 5:16:20-5:23:50 UT (2.1 Mb MPEG), (1.1 Mb Quicktime)
2 panel animations, Nov. 3rd, 1700-Nov. 4, 1200 UT
Electric Potential with Electric Field Observations (2.3 Mb MPEG), (1.3 Mb Quicktime)
Electric Potential with Magnetic Field Observations (2.9 Mb MPEG), (1.5 Mb Quicktime)
Total Hall Conductance with Hall Conductance Observations (3.2 Mb MPEG), (1.7 Mb Quicktime)
Field Aligned Currents with Magnetic Field Observations (2.6 Mb MPEG), (1.4 Mb Quicktime)
Horizontal Currents with Magnetic Field Observations (3.2 Mb MPEG), (1.7 Mb Quicktime)
2 panel animations, Nov. 3rd, 0000-Nov. 5, 0000 UT
Electric Potential with Electric Field Observations,
(6.3 Mb MPEG), (1.1 Mb Quicktime)
Traveling Convection Vortices
Horizontal Currents with Magnetic Field Observations, Nov. 4th, 1200 UT to Nov. 5th, 1500 UT (5.3 Mb MPEG), (733 Kb Quicktime)
About Quicktime
If you need a Quicktime player for your particular computer you can obtain the necessary software from the Cross-Platform Quicktime web page.
If you would like to know how these sequences were generated see the tutorial on generating Quicktime and Mpeg movies.

National Space Weather Initiative - November 1993 Event Study
Magnetospheric Specification Model at Rice University
University of Iowa Plasma Wave Investigations
Polar Plasma Wave Investigation
IMP-8 Project Information
Space Physics at the NSSDC
Modeling of Atmosphere-Magnetosphere-Ionosphere System
Spacecraft: POLAR Brief Description

 Return to HAO homepage.