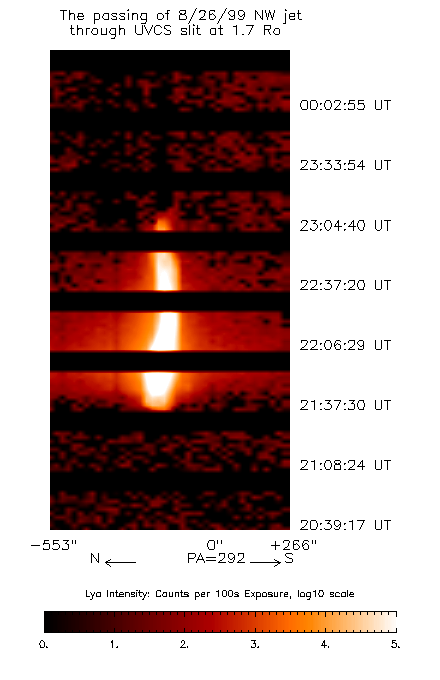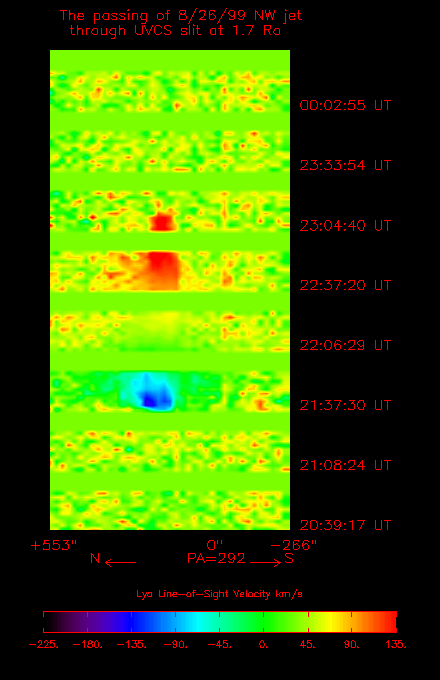
UVCS observations show the variation both in time and
space:
 |
LyA line intensities (counts per 100 second exposure) as a function of time as the jet passed through the slit at 1.7 Ro. The intensities are background corona subtracted. |
 |
LyA line-of-sight velocities (km/s) as a function of time as the jet passed through the slit at 1.7 Ro. |
Note that the velocities are first blue-shifted, then red-shifted. This is the opposite behavior from CDS observations at lower heights, where first red-shifted, then blue-shifted velocities are observed.