Do it yourself NCL Script examples
Profiles (Zp/Height vs field)
| These profile plot are basically xy plots. You can learn more about xy options on the CCSM line example page. |
prof_1.ncl:
Default black and white plot with multiple lines.
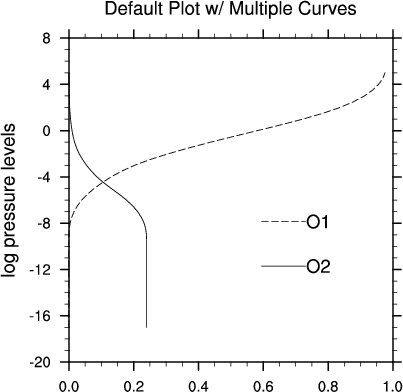
Note that in default mode, the first line is solid, the second is dashed. If there were more lines, they would each have a separate pattern. Legends are very complicated. For more details about how they work, see legends There are four title strings you can use to label a plot. The gsnLeftString is automatically labeled with the long_name of the data, and gsnRightString is labeled with the units of the data. These can both be overwritten, or turned off (by setting them to ""). There is also gsnCenterString and the plot title tiMainString.br> |
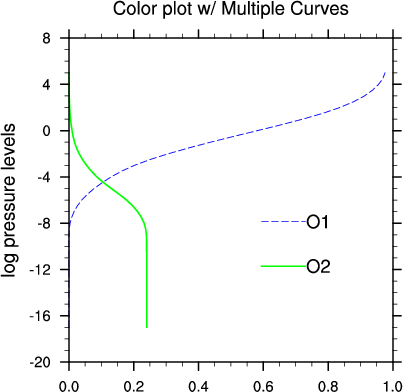
prof_2.ncl:
Adds color
 xyLineColors and xyLineThicknesses are two useful resources to control the line style. |
prof_3.ncl:
Demonstrates how to limit the axis.
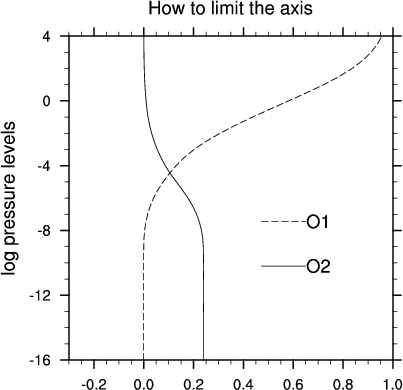 trYMinF, trYMaxF, trXMinF, trXMaxF can be use to limit the x and y axis. |